








Broadcom: Fiscal 4Q19 Financial Results
Storage held up driven by increased demand for high-capacity drives and SAN switching demand remains muted.
This is a Press Release edited by StorageNewsletter.com on December 17, 2019 at 2:28 pm| (in $ million) | 4Q18 | 4Q19 | FY18 | FY19 |
| Revenue | 5,444 | 5,776 | 20,848 | 22,597 |
| Growth | 6% | 8% | ||
| Net income (loss) | 1,115 | 847 | 12,610 | 2,724 |
Broadcom Inc. reported financial results for its fourth fiscal quarter and fiscal year ended November 3, 2019.
The company completed its acquisition of the Symantec Enterprise Security business on November 4, 2019. The financial results provided below do not include any contribution from this business.
“Fiscal year 2019 concluded as expected. Our semiconductor solutions segment continued to work its way through a cyclical correction. This was more than offset by our infrastructure software segment, which delivered healthy results benefitting from the integration and performance of our CA business,” said Hock Tan, president and CEO. “Looking to FY20, we remain well-positioned across our technology franchises. We continue to believe that our core semiconductor business is bottoming and will return to Y/Y growth in the second half of our fiscal year. In addition, we expect to benefit from the integration of the Symantec Enterprise Security business into what is otherwise expected to be a stable infrastructure software segment in fiscal 2020.”
“We achieved record profitability in fiscal 2019, including free cash flow of over $9 billion, despite a challenging market backdrop for our semiconductor solutions segment. As a result, we are raising our target dividend by 23% to $3.25 per share per quarter for fiscal year 2020,” said Tom Krause, CFO. “Looking ahead to next year, we expect our adjusted EBITDA to expand by more than $1 billion, while we focus our capital returns on cash dividends, with excess cash going towards debt pay down.”
4FQ19 GAAP Results from Continuing Operations
- Net revenue was $5,776 million, 4.7% higher than $5,515 million in t3FQ19 and 6.1% higher than $5,444 million in 4FQ18.
- Gross margin was $3,152 million, or 54.6% of net revenue. This compares with gross margin of $3,034 million, or 55.0% of net revenue, in the 3FQ19, and gross margin of $2,935 million, or 53.9% of net revenue, in 4FQ18.
- Operating expenses were $2,098 million. This compares with $2,169 million in 3FQ19 and $1,283 million in 4FQ18.
- Operating income was $1,054 million, or 18.2% of net revenue. This compares with operating income of $865 million, or 15.7% of net revenue, in 3FQ19, and operating income of $1,652 million, or 30.3% of net revenue, in 4FQ18.
- Net income was $847 million, or $1.97 per diluted share. This compares with net income of $715 million, or $1.71 per diluted share, in 3FQ19, and net income of $1,115 million, or $2.64 per diluted share, in 4FQ18.
- Cash from operations was $2,479 million in 4FQ19. This compares with $2,419 million in 3FQ19 and $2,635 million in 4FQ18.
- Cash and cash equivalents at the end of 4FQ19 were $5,055 million, compared to $5,462 million at the end of 3FQ19.
During 4FQ19, the company generated $2,479 million in cash from operations and spent $587 million on share repurchases and eliminations, consisting of $433 million in repurchases of 1.5 million shares and $154 million of withholding tax payments related to net settled equity awards that vested in the quarter (representing approximately 0.5 million shares withheld), as well as $96 million on capital expenditures.
On October 1, 2019, the company paid a cash dividend of $2.65 per share of common stock, totaling $1,054 million.
4FQ19 Non-GAAP Results From Continuing Operations
- Gross margin was $4,035 million, or 69.9% of net revenue. This compares with gross margin of $3,916 million, or 71.0% of net revenue, in 3FQ19, and $3,725 million, or 68.4% of net revenue, in 4FQ18.
- Operating income was $3,018 million, or 52.3% of net revenue. This compares with operating income of $2,910 million, or 52.8% of net revenue, in 3FQ19, and $2,862 million, or 52.5% of net revenue, in 4FQ18.
- Net income was $2,391 million, or $5.39 per diluted share. This compares with net income of $2,281 million, or $5.16 per diluted share, in 3FQ19, and net income of $2,546 million, or $5.85 per diluted share, in 4FQ18.
- Free cash flow from operations, defined as cash from operations less capital expenditures, was $2,383 million in 4FQ19. This compares with $2,307 million in the prior quarter and $2,529 million in 4FQ18.
FY19 Financial Results from Continuing Operations
Net revenue from continuing operations was $22,597 million, an increase of 8.4% from $20,848 million in 3FQ19. Gross margin was $12,483 million, or 55.2% of net revenue, vs. $10,733 million, or 51.5% of net revenue, in 3FQ19. Operating income was $3,444 million, or 15.2% of net revenue, vs. $5,135 million, or 24.6% of net revenue, in 3FQ19. Net income, which includes the impact from discontinued operations, was $2,724 million, or $6.43 per diluted share. This compares with a net income of $12,610 million, or $28.44 per diluted share, in FY18. Cash from operations was $9,697 million, compared to $8,880 million in FY18.
Non-GAAP gross margin was $16,055 million, or 71.0% of net revenue, vs. $13,931 million, or 66.8% of net revenue, in FY18. Non-GAAP operating income from continuing operations was $11,929 million. This compares with $10,424 million in FY18. Non-GAAP net income was $9,452 million, or $21.29 per diluted share. This compares with non-GAAP net income of $9,391 million, or $20.82 per diluted share, in FY18. Free cash flow from operations, defined as cash from operations less capital expenditures, was $9,265 million compared to $8,245 million in FY18.
FY20 Business Outlook
Based on current business trends and conditions, the outlook for continuing operations for FY20, ending November 1, 2020, including contributions from the Symantec Enterprise Security business, is expected to be as follows:
- Revenue is expected to be $25 billion plus or minus $500 million.
- Adjusted EBITDA is expected to be $13.75 billion plus or minus $250 million.
Quarterly Dividends
The board of directors has approved a quarterly cash dividend on its common stock of $3.25 per share. It is payable on December 31, 2019 to common stockholders of record at the close of business on December 23, 2019.
The board also approved a quarterly cash dividend on its 8.00% Mandatory Convertible Preferred Stock, Series A, of $20.00 per share. This dividend is payable on December 31, 2019 to preferred stockholders of record at the close of business on December 15, 2019.
Comments
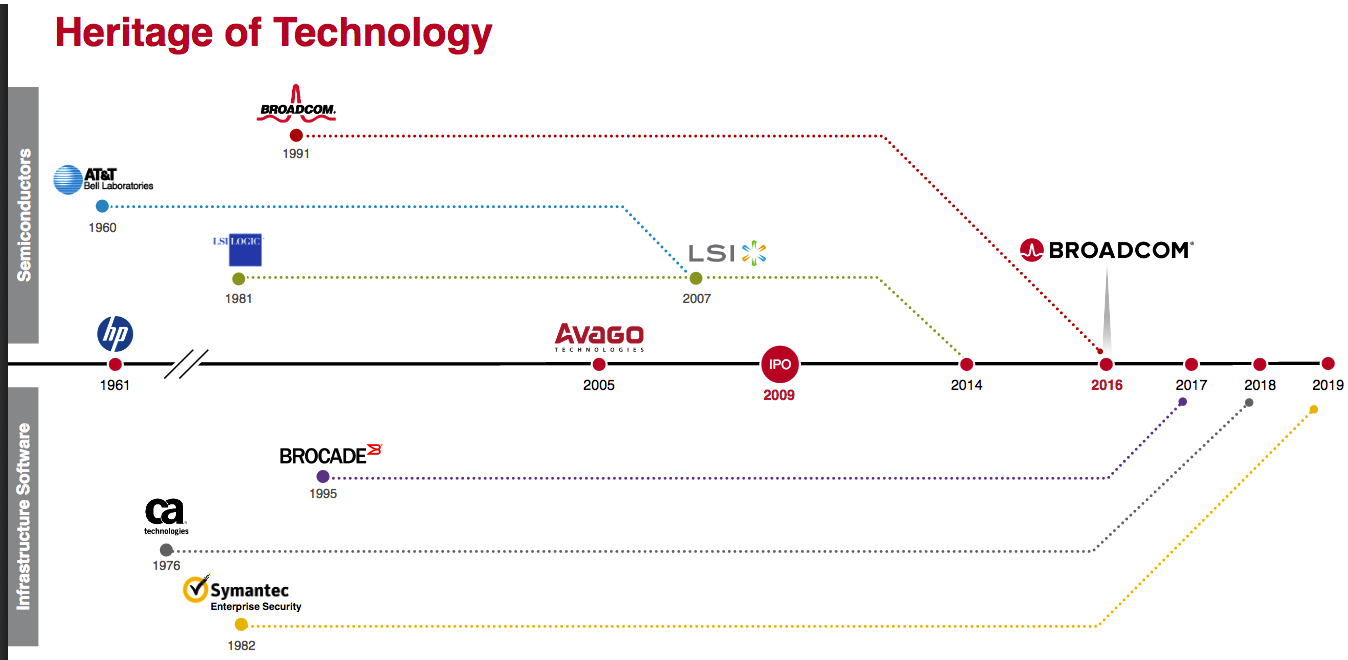
Being in storage since its acquisition of Brocade in 2017 for $5.5 billion, Broadcom didn't give any figure on this business, but offers only the following comments:
"Storage also held up driven by increased demand for high-capacity drives. (...) SAN switching demand remains muted as our partner OEM supply chain continues to compress."
Brocade was first involved in FC connectivity - a market going down as it's competing with rapidly growing NVMe PCIe -, and then in expanding Ethernet .
Broadcom also acquires last year CA Technologies for as high as $18.9 billion, a surprising deal as the acquirer never was involved in mainframe management software.
Last August it bought Symantec Enterprise Security for $10.7 billion in cash.







 Subscribe to our free daily newsletter