


Phison: Fiscal 1Q26 Financial Results
Revenue of NT$40.967 billion, up 79.7% QoQ and up 196% YoY
This is a Press Release edited by StorageNewsletter.com on May 19, 2026 at 2:00 pmSummary:
- The consolidated operating revenue for this quarter was NT$40.967 billion, an increase of 79.7% from the previous quarter and an increase of 196.0% compared to the same period last year
- The consolidated gross margin rate for this quarter was 61.3%, an increase of 19.6% from the previous quarter and an increase of 30.4% compared to the same period last year
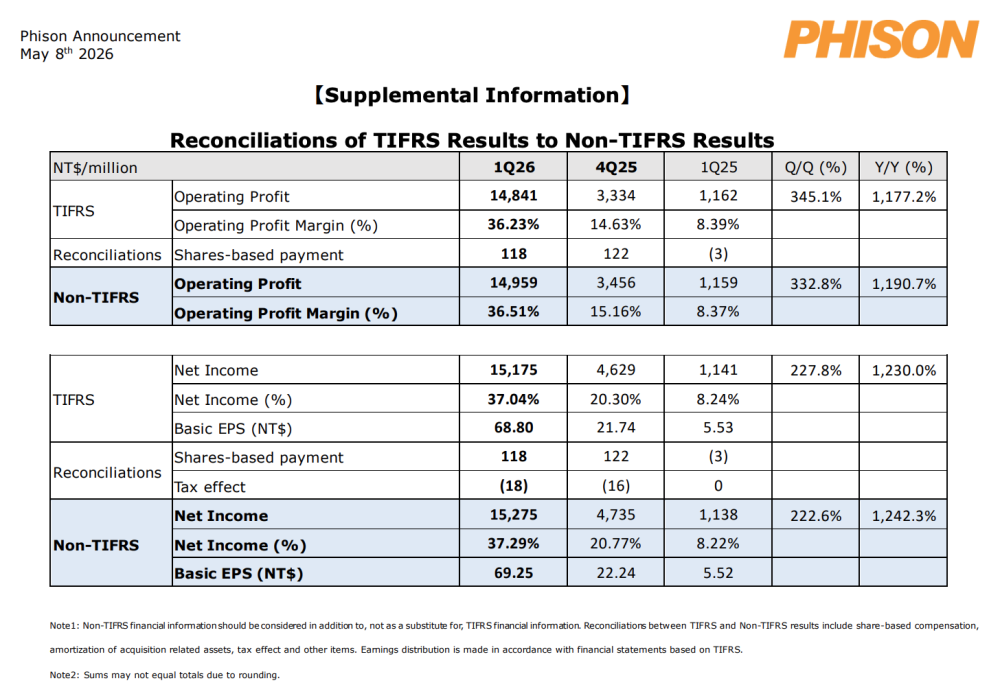
- The consolidated operating income for this quarter was NT$14.841 billion, an increase of 345.1% from the previous quarter and an increase of 1,177.5% compared to the same period last year
- The consolidated net income for this quarter was NT$15.175 billion; with earnings per share of NT$68.80
Phison Electronics announced financial results of first-quarter ended March 31, 2026.![]() Consolidated Revenue
Consolidated Revenue
The consolidated operating revenue for the first-quarter of 2026 was NT$40.967 billion, representing an increase of 79.7% compared to the previous quarter and an increase of 196.0% compared to the same period last year.
Click to enlarge
Consolidated Gross Profit and Gross Margin
The consolidated gross profit for this quarter was NT$25.118 billion, reflecting a 164.4% increase from the previous quarter and a 486.8% increase from the same period last year. The consolidated gross margin for the quarter was 61.3%, making a 19.6% increase from the previous quarter and a 30.4% increase from the same period last year.
The operating expenses for this quarter amounted to NT$10.277 billion (25.1% of revenue), compared to NT$6.166 billion (27.0% of revenue) in the previous quarter and NT$3.119 billion (22.5% of revenue) for the same period last year.
Operating expenses for the quarter included:
- R&D expenses totaled NT$8.671 billion (21.2% of operating revenue), which is higher than the previous quarter’s NT$5.254 billion (23.0% of operating revenue) and higher than the same period last year’s NT$2.566 billion (18.5% of operating revenue)
- Marketing expenses amounted to NT$0.776 billion (1.9% of operating revenue), higher than the previous quarter’s NT$0.555 billion (2.4% of operating revenue) and higher than the same period last year’s NT$0.347 billion (2.5% of operating revenue)
- General and administrative expenses amounted to NT$0.831 billion (2.0% of operating revenue), higher than the previous quarter’s NT$0.438 billion (1.9% of operating revenue) and higher than the same period last year’s NT$0.244 billion (1.8% of operating revenue)
Phison’s operating expenses in the first quarter increased compared to both the previous quarter and the same period last year, primarily due to the company’s continued strategic investments in long-term technology and product development, including advanced process R&D, mask costs, AI storage and edge AI platform development, as well as talent recruitment and enhanced employee compensation. These investments represent Phison’s proactive commitment to future growth opportunities. Phison’s continued investment in R&D and talent development will help increase the contribution of high-value products, strengthen the company’s competitive advantages, and support long-term revenue and profitability growth. Phison has successfully captured business opportunities arising from the current AI wave and will continue expanding its market share in AI ecosystem-related solutions.
Consolidated Operating Income and Operating Margin
The operating income for this quarter was NT$14.841 billion, which was an increase of 345.1% from the previous quarter and an increase of 1,177.5% from the same period last year. The operating profit margin for this quarter was 36.2%, higher than the previous quarter’s 14.6% and higher than the same period last year’s 8.4%.
Consolidated Non-Operating Income (loss) and Income Tax
The non-operating incomes for this quarter was NT$3.057 billion, or 7.5% of operating revenue. This was mainly due to the gains and losses of investments for using the equity method, the net foreign exchange gains and gains and losses on financial assets at fair value through profit or loss. The income tax expense for this quarter was NT$2.723 billion.
Consolidated Net Income, Net Profit Margin and EPS
The net income for this quarter was NT$15.175 billion, an increase of 227.8% from the previous quarter and an increase of 1,230.3% from the same period last year. The net profit margin for this quarter was 37.0%, higher than the previous quarter’s 20.3% and higher than the same period last year’s 8.2%. Earnings per share (EPS) for this quarter was NT$68.80, higher than the previous quarter’s NT$21.74 and higher than the same period last year’s NT$5.53.
Consolidated Cash and Financial Assets-Current
Cash and Financial assets at fair value-current at the end of this quarter was NT$22.575 billion, which presents 16.0% of total assets. Cash and Financial assets at fair value-current was NT$17.709 billion and NT$18.538 billion at the end of the previous quarter and the same period last year, respectively. Financial assets-current portfolio includes funds, domestic listed stocks, derivatives and so on.
Consolidated Accounts Receivable
The net accounts receivable at the end of this quarter was NT$22.750 billion, with an average accounts receivable turnover of 41 days (calculated based on the average net receivables for this quarter and the annualized current sales revenue), which is lower than the 54 days of the previous quarter and lower than the 56 days of the same period last year.
Consolidated Inventory
The net inventory at the end of this quarter amounted to NT$72.199 billion. The company’s inventory is mostly applied to the Non-Retail market. The company will continue to closely monitor market demand and adjust inventory according to its strategies. The average inventory turnover days for this quarter is 315 days (calculated based on the average net inventory for this quarter and the annualized cost of goods sold), which is higher than the 231 days of the previous quarter and higher than the 253 days of the same period last year.
Comments
Confirming its leader position for independent NAND controller globally, selling both controller ICs and turnkey SSD modules.


 Subscribe to our free daily newsletter


