


Varonis: Fiscal 4Q25 and FY25 Financial Results
Generating $623.5 million, up 13% YoY
This is a Press Release edited by StorageNewsletter.com on February 13, 2026 at 2:01 pmSummary:
- Annual recurring revenues increased 16% YoY
- SaaS ARR, excluding conversions increased 32% YoY
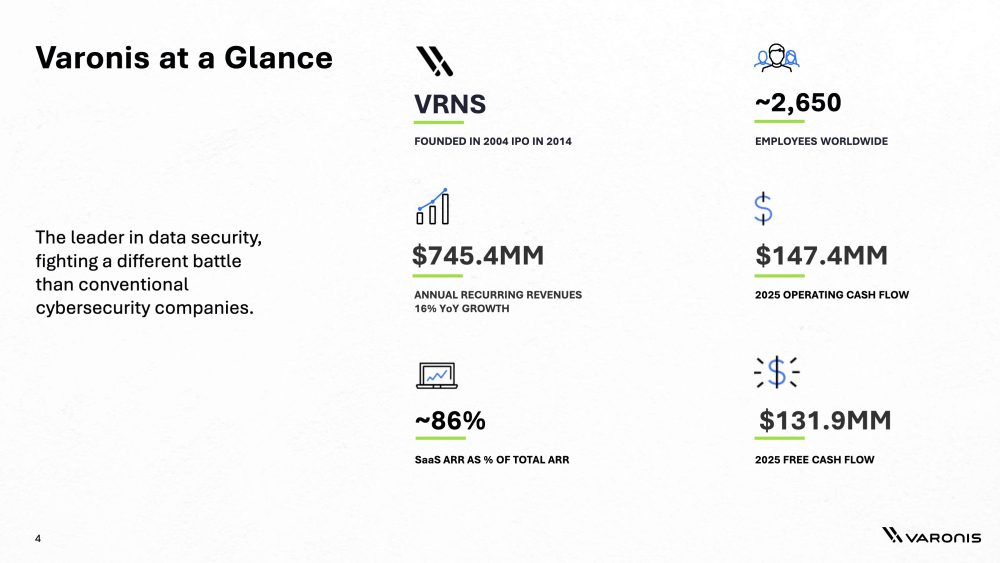
- SaaS ARR as a percentage of total ARR was approximately 86%
- Year-to-date cash from operations generated $147.4 million vs. $115.2 million last year
- Year-to-date free cash flow generated $131.9 million vs. $108.5 million last year
Varonis Systems, Inc., an active player in data security, announced financial results for the fourth quarter and full-year ended December 31, 2025.![]() Yaki Faitelson, CEO, Varonis, said, “We are excited by the performance of our SaaS business, which saw ARR growth of 32%, excluding conversions, and is being driven by the automated value proposition we deliver to our customers. We look forward to continuing our momentum and ending 2026 as a fully SaaS company, which will unlock many more benefits as we capture our growing market opportunity. We continue to believe in the path to achieving our 2027 financial targets.”
Yaki Faitelson, CEO, Varonis, said, “We are excited by the performance of our SaaS business, which saw ARR growth of 32%, excluding conversions, and is being driven by the automated value proposition we deliver to our customers. We look forward to continuing our momentum and ending 2026 as a fully SaaS company, which will unlock many more benefits as we capture our growing market opportunity. We continue to believe in the path to achieving our 2027 financial targets.”
Guy Melamed, CFO & COO, Varonis, added, “Our fourth quarter performance showed strong momentum in our SaaS business from both new and existing SaaS customers as well as a meaningful growth in self-hosted customers converting to SaaS. We ended this quarter with SaaS ARR of $638.5 million or 86% of total ARR, and successfully converted approximately one-third of our remaining self-hosted customers to SaaS.”
Financial Summary for the Fourth Quarter Ended December 31, 2025
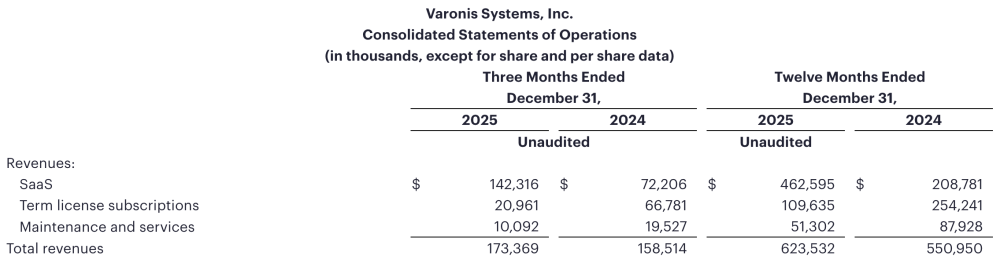
- Total revenues were $173.4 million, compared with $158.5 million in the fourth quarter of 2024
- SaaS revenues were $142.3 million, compared with $72.2 million in the fourth quarter of 2024
- Term license subscription revenues were $21.0 million, compared with $66.8 million in the fourth quarter of 2024, with the vast majority of the decline driven by customers converting to our SaaS platform
- Maintenance and services revenues were $10.1 million, compared with $19.5 million in the fourth quarter of 2024, with the vast majority of the decline driven by customers converting to our SaaS platform
- GAAP operating loss was ($30.3) million, compared to GAAP operating loss of ($17.6) million in the fourth quarter of 2024
- Non-GAAP operating income was $4.6 million, compared to non-GAAP operating income of $15.3 million in the fourth quarter of 2024
Financial Summary for the Year Ended December 31, 2025
- Total revenues were $623.5 million, compared with $551.0 million in 2024
- SaaS revenues were $462.6 million, compared with $208.8 million in 2024
- Term license subscription revenues were $109.6 million, compared with $254.2 million in 2024, with the vast majority of the decline driven by customers converting to our SaaS platform
- Maintenance and services revenues were $51.3 million, compared with $87.9 million in 2024, with the vast majority of the decline driven by customers converting to our SaaS platform
- GAAP operating loss was ($146.5) million, compared to GAAP operating loss of ($117.7) million in 2024
- Non-GAAP operating loss was ($3.6) million, compared to non-GAAP operating income of $15.9 million in 2024
The tables at the end of this press release include a reconciliation of GAAP operating income (loss) to non-GAAP operating income (loss) and GAAP net income (loss) to non-GAAP net income (loss) for the three and twelve months ended months ended December 31, 2025 and 2024. An explanation of these measures is included below under the heading “Non-GAAP Financial Measures and Key Performance Indicators.”
Key Performance Indicators and Recent Business Highlights
- Annual recurring revenues, or ARR, was $745.4 million as of the end of the fourth quarter, up 16% YoY
- SaaS ARR, was $638.5 million as of the end of the fourth quarter, up 88% year-over-year or up 32% YoY excluding conversions
- As of December 31, 2025, the Company had $1.1 billion in cash and cash equivalents, short-term deposits and short-term and long-term marketable securities
- During the twelve months ended December 31, 2025, the Company generated $147.4 million of cash from operations, compared to $115.2 million generated in the prior year period
- During the twelve months ended December 31, 2025, the Company generated $131.9 million of free cash flow, compared to $108.5 million generated in the prior year period
- Entered into agreement to acquire AllTrue.ai, Inc, an AI security company that provides visibility and control across the AI lifecycle and strengthens Varonis’ ability to help customers safely adopt AI
- Announced integration with AWS Security Hub to provide security teams with advanced visibility, automated fixes, and proactive threat detection
- Launched Microsoft Purview DSPM integration to help organizations see and understand their critical data across third-party platforms alongside their Microsoft data
- Recognized as a finalist for the 2025 Microsoft Partner of the Year Award in the Marketplace category
An explanation of SaaS ARR and ARR is included below under the heading “Non-GAAP Financial Measures and Key Performance Indicators.” In addition, the tables at the end of this press release include a reconciliation of net cash provided by operating activities to non-GAAP free cash flow. An explanation of this measure is also included below under the heading “Non-GAAP Financial Measures and Key Performance Indicators.”
Financial Outlook
For the first quarter of 2026, the Company expects:
- SaaS ARR YoY growth of 27% to 28%, excluding conversions
- Revenues of $164.0 million to $166.0 million, or YoY growth of 20% to 22%
- Non-GAAP operating loss of ($11.0) million to ($10.0) million
- Non-GAAP net loss per basic and diluted share in the range of ($0.06) to ($0.05), based on 118.0 million basic and diluted shares outstanding
For full year 2026, the Company expects:
- SaaS ARR of $805.0 million to $840.0 million, or YoY growth of 26% to 32%
- SaaS ARR YoY growth of 18% to 20%, excluding conversions
- Free cash flow of $100.0 million to $105.0 million
- Revenues of $722.0 million to $730.0 million, or YoY growth of 16% to 17%
- Non-GAAP operating income of $0.0 to $4.0 million
- Non-GAAP net income per diluted share in the range of $0.06 to $0.10, based on 134.2 million diluted shares outstanding
Actual results may differ materially from the company’s financial outlook as a result of, among other things, the factors described below under “Forward-Looking Statements”.
Click to enlarge
Click to enlarge


 Subscribe to our free daily newsletter


