Astera Labs: Fiscal 2Q25 Financial Results
Revenue of $191.9 million, up 20% Q/Q and 150% Y/Y, $203-$210 million expected for next quarter
This is a Press Release edited by StorageNewsletter.com on August 15, 2025 at 2:02 pmSummary:
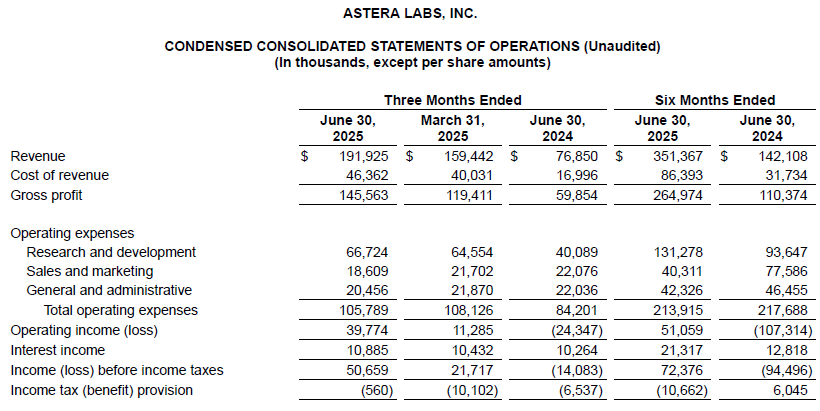
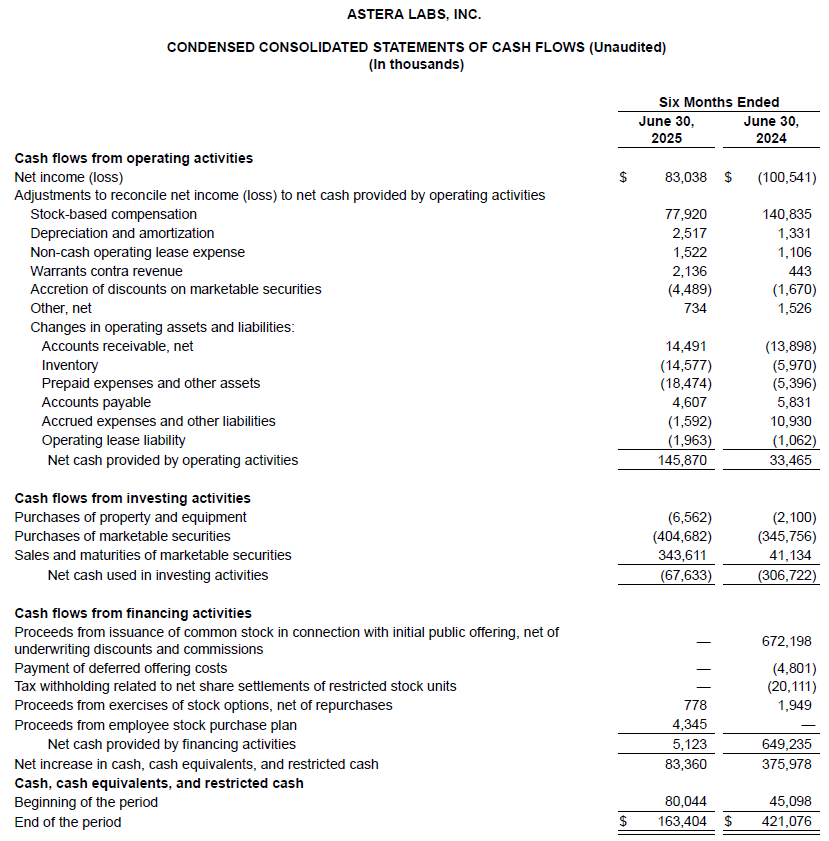
- Record quarterly revenue of $191.9 million, up 20% Q/Q and 150% Y/Y, and record operating cash flow generation of $135.4 million
- PCIe 6 connectivity portfolio ramping in volume on customized rack-scale AI systems
- Scorpio Fabric Switch design wins expand across multiple new customers and applications
Astera Labs, Inc. announced preliminary financial results for the second quarter of fiscal year 2025, ended June 30, 2025.

“Astera Labs delivered strong financial results in Q2 with sequential revenue growth of 20 percent, driving meaningful upside to earnings and cash flow from operations,” said Jitendra Mohan, CEO, Astera Labs. “During Q2, we successfully executed the next step in our growth journey by ramping our PCIe 6 product portfolio into volume production for customized rack-scale AI systems and added multiple new design wins for our Scorpio Fabric Switches. We also saw strong demand for our signal conditioning portfolio driven by PCIe scale-up and Ethernet scale-out connectivity applications in custom ASIC platforms. Astera Labs is at the forefront of an AI infrastructure transformation, and we are accelerating our investments to realize our vision of rack-scale connectivity in next gen AI systems.“
Second Quarter 2025 Financial Highlights
GAAP Financial Results:
- Revenue of $191.9 million, up 20% sequentially and up 150% Y/Y
- GAAP gross margin of 75.8%
- GAAP operating income of $39.8 million
- GAAP operating margin of 20.7%
- GAAP net income of $51.2 million
- GAAP diluted earnings per share of $0.29
Non-GAAP Financial Results (excluding the impact of stock-based compensation expense and the income tax effects of non-GAAP adjustments):
- Non-GAAP gross margin of 76.0%
- Non-GAAP operating income of $75.2 million
- Non-GAAP operating margin of 39.2%
- Non-GAAP net income of $78.0 million
- Non-GAAP diluted earnings per share of $0.44
Q2 2025 and Recent Business Highlights
- Expanded collaboration with NVIDIA to advance the NVLink Fusion ecosystem and expand the options available for hyperscalers to deploy scale-up networks based on NVIDIA NVLink technology. Company will provide NVLink connectivity solutions to further expand our Intelligent Connectivity Platform, which integrates PCIe, CXL, and Ethernet silicon and hardware solutions with the COSMOS suite to enhance data center visibility while optimizing system performance.
- Hosted comprehensive Ultra Accelerator Link (“UALink”) public webinar to discuss the fundamentals of the UALink technology, outline the UALink market opportunity, and demonstrate how Astera Labs is positioned to help proliferate the open, memory-semantic fabric that delivers high-bandwidth, low latency, and broad interoperability. As a promoter member of the UALink Consortium, Astera Labs is working closely with industry partners to advance this open connectivity ecosystem that helps unleash the next gen of performing and scalable AI platforms.
- Joined AMD on stage for its Advancing AI 2025 keynote presentation as a trusted partner to help showcase the ecosystem collaborating to power the next era of AI. Together, the 2 companies highlighted how UALink connectivity solutions will be critical for enabling scale-up architectures for the next gen of AI infrastructure. UAL represents the only open standard designed specifically for scale-up applications. It combines the best of many protocols to provide a fast and efficient architecture supported by a broad ecosystem to deliver choice and flexibility to customers.
- Announced partnership with ASIC leader, Alchip Technologies, to advance the silicon ecosystem for AI rack-scale infrastructure through the integration of purpose-built compute and connectivity solutions. The collaboration combines Alchip’s custom ASIC development capabilities with Astera Labs’ connectivity portfolio to deliver validated and interoperable solutions for hyperscalers building next gen AI infrastructure.
Third Quarter of Fiscal 2025 Financial Outlook
Based on current business trends and conditions, Astera Labs estimates the following:
GAAP Financial Outlook:
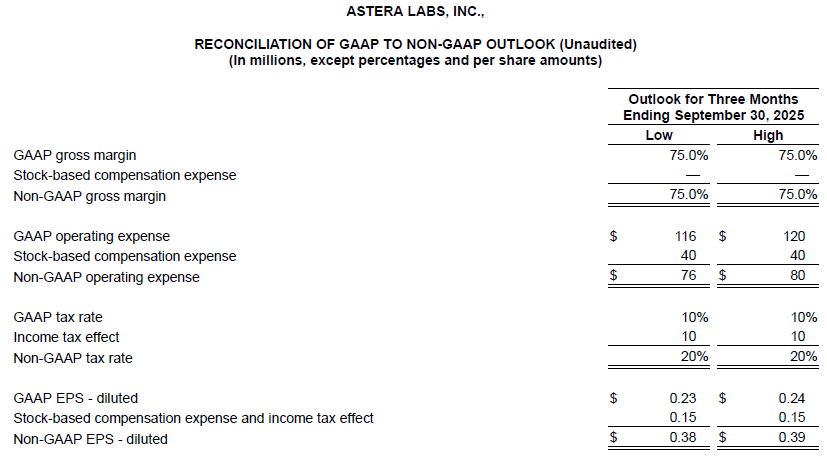
- Revenue within a range of $203 million to $210 million
- GAAP gross margin of approximately 75%
- GAAP operating expenses within a range of approximately $116 million to $120 million
- GAAP tax rate of approximately 10%
- GAAP diluted earnings per share in a range of approximately $0.23 to $0.24 on weighted-average diluted shares outstanding of approximately 180 million
Non-GAAP Financial Outlook (excluding the impact of stock-based compensation expense and the income tax effects of non-GAAP adjustments):
- Non-GAAP gross margin of approximately 75%
- Non-GAAP operating expenses within a range of approximately $76 million to $80 million
- Non-GAAP tax rate of approximately 20%
- Non-GAAP diluted earnings per share in a range of approximately $0.38 to $0.39 on non-GAAP weighted-average diluted shares outstanding of approximately 180 million
Astera Labs hosted a conference call on August 5th to review its financial results for the second quarter of fiscal 2025 and to discuss financial outlook. A webcast is available the next 6 months, registration required.
Discussion of Non-GAAP Financial Measures
We use certain non-GAAP financial measures, including those concerning our financial outlook, to supplement the performance measures in our consolidated financial statements, which are presented in accordance with GAAP. A reconciliation of these non-GAAP measures to the closest GAAP measure can be found later in this release. The timing and impact of any adjustments to arrive at the corresponding GAAP financial measures concerning our financial outlook are inherently dependent on future events that are typically uncertain or that may be outside of our control. These non-GAAP financial measures include non-GAAP gross profit, non-GAAP gross margin, non-GAAP operating expenses, non-GAAP operating income, non-GAAP operating margin, non-GAAP tax rate, non-GAAP net income, non-GAAP pro forma diluted earnings per share, and non-GAAP pro forma weighted-average share count. We use these non-GAAP financial measures for financial and operational decision-making and as a means to assist us in evaluating period-to-period comparisons. By excluding certain items that may not be indicative of our recurring core operating results, we believe that, non-GAAP gross profit, non-GAAP gross margin, non-GAAP operating expenses, non-GAAP operating income, non-GAAP operating margin, non-GAAP tax rate, non-GAAP net income, non-GAAP pro forma diluted earnings per share, and non-GAAP pro forma weighted-average share count provide meaningful supplemental information regarding our performance. Accordingly, we believe these non-GAAP financial measures are useful to investors and others because they allow for additional information with respect to financial measures used by management in its financial and operational decision-making and they may be used by our institutional investors and the analyst community to help them analyze the health of our business. However, there are a number of limitations related to the use of non-GAAP financial measures, and these non-GAAP measures should be considered in addition to, not as a substitute for or in isolation from, our financial results prepared in accordance with GAAP. Other companies, including companies in our industry, may calculate these non-GAAP financial measures differently or not at all, which reduces their usefulness as comparative measures.
We adjust the following items from one or more of our non-GAAP financial measures:
Stock-based compensation expense
We exclude stock-based compensation expense, which is a non-cash expense, from certain of our non-GAAP financial measures because we believe that excluding this item provides meaningful supplemental information regarding operational performance. In particular, companies calculate non-cash stock-based compensation expense using a variety of valuation methodologies and subjective assumptions. Moreover, stock-based compensation expense is a non-cash charge that can vary significantly from period to period for reasons that are unrelated to our core operating performance, and therefore excluding this item provides investors and other users of our financial information with information that allows meaningful comparisons of our business performance across periods.
Employer payroll taxes related to stock-based compensation resulting from our IPO
We exclude employer payroll taxes related to the time-based vesting and net settlement of restricted stock units in connection with our initial public offering (the “IPO”), because this does not correlate to the operation of our business. We believe that excluding this item provides meaningful supplemental information regarding operational performance given the amount of employer payroll tax-related items on employee stock transactions was immaterial prior to our IPO.
Income tax effect
This represents the impact of the non-GAAP adjustments on an after-tax basis and one-off discrete tax adjustments that are unrelated to our core operating performance in connection with the presentation of non-GAAP net income and non-GAAP net income per diluted share. This approach is designed to enhance investors’ ability to understand the impact of our non-GAAP tax expense on our current operations, provide improved modeling accuracy, and substantially reduce fluctuations caused by GAAP to non-GAAP adjustments.
Non-GAAP pro forma weighted-average shares to compute non-GAAP pro forma net income per share
We present non-GAAP pro forma weighted-average shares, assuming our redeemable convertible preferred stock is converted from the beginning of each respective periods presented, to provide meaningful supplemental information regarding EPS trend on a consistent basis. All of our outstanding redeemable preferred stock converted into the equivalent number of shares of common stock in connection with our IPO.
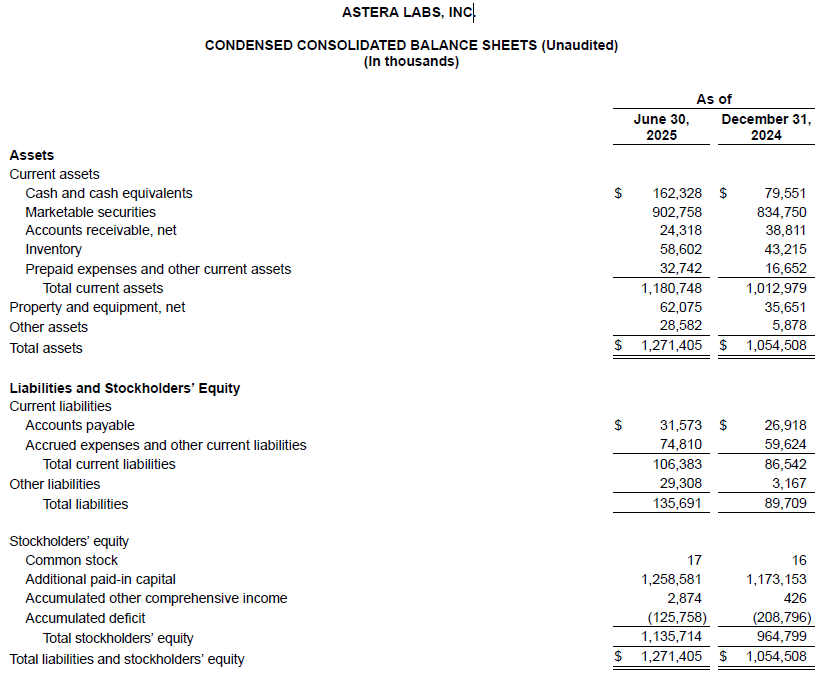

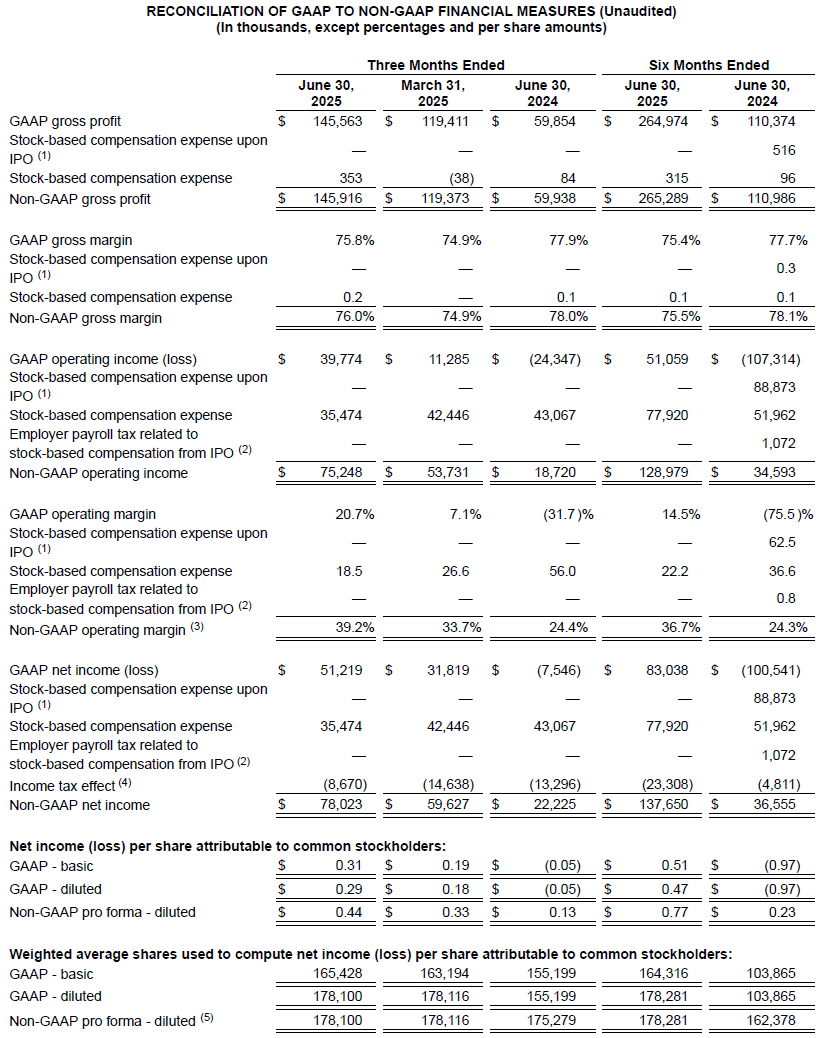
(1) Stock-based compensation expense recognized in connection with the time-based vesting and settlement of RSUs that had previously met the time-based vesting condition and for which the liquidity event vesting condition was satisfied in connection with our IPO.
(2) Employer payroll taxes related to the time-based vesting and settlement of RSUs, that had previously met the time-based vesting condition and for which the liquidity event vesting condition was satisfied in connection with our IPO.
(3) Total may not sum due to rounding.
(4) Income tax effect is calculated based on the tax laws in the jurisdictions in which we operate and is calculated to exclude the impact of stock-based compensation expense and one-off discrete tax adjustments that are unrelated to our core operating performance. We no longer maintain valuation allowance for non-GAAP purposes due to our profitability on a non-GAAP basis. For the three months ended June 30, 2025, March 31, 2025, and June 30, 2024, the non-GAAP tax expense rate was approximately 9%, 7%, and 23%, respectively. For the six months ended June 30, 2025 and 2024, the non-GAAP tax expense rate was approximately 8% and 23%, respectively.
(5) We present the non-GAAP pro-forma weighted average shares to provide meaningful supplemental information of comparable shares for each period presented. The non-GAAP pro forma weighted average shares is calculated as follows:



Comments
To summarize Astera Labs delivers a strong Q2 FY 2025 at $191 million with +20% sequentially and +150% YoY, close to 3 times. It comes from $159 million in Q1 FY25. Q2 FY 2024 was $76 million. For H1 FY2024, the revenue was $142 million but H1 FY2025 already delivered $351 million, +147%.
The company founded in 2017 with 4 rounds for a total of $206 million of funding did its IPO in March 2024 at $36 per share. The stock jumped at $190 at the closing yesterday and the valuation reached $31 billion.
All these positive news confirm that PCIe Gen 6 and fabric switches are hot, associated with CXL and UALink, all connectivity aspects really pulled by the AI demand and hyperscalers, literally dominating the segment.


 Subscribe to our free daily newsletter

