


Silicon Motion: Fiscal 2Q25 Financial Results
Revenue of $198.7 million, up 19% Q/Q, down 6% Y/Y
This is a Press Release edited by StorageNewsletter.com on August 13, 2025 at 2:02 pmBusiness Highlights
- Second quarter of 2025 sales increased 19% Q/Q and decreased 6% Y/Y
- SSD controller sales: 2Q of 2025 increased 0% to 5% Q/Q and decreased 15% to 20% Y/Y
- eMMC+UFS controller sales: 2Q of 2025 increased 40% to 45% Q/Q and increased 10% to 15% Y/Y
- SSD solutions sales: 2Q of 2025 increased 0% to 5% Q/Q and decreased 45% to 50% Y/Y
Financial Highlights
| 2Q 2025 GAAP | 2Q 2025 Non-GAAP* | |||||
| • Net sales | $198.7 million (+19% Q/Q, -6% Y/Y) | $198.7 million (+19% Q/Q, -6% Y/Y) | ||||
| • Gross margin | 47.7% | 47.7% | ||||
| • Operating margin | 11.2% | 12.8% | ||||
| • Earnings per diluted ADS | $0.49 | $0.69 | ||||
* See supplemental reconciliations of US Generally Accepted Accounting Principles (GAAP) to all non-GAAP financial measures mentioned herein towards the end of this news release.
Silicon Motion Technology Corporation announced its financial results for the quarter ended June 30, 2025.

For the second quarter of 2025, net sales (GAAP) increased sequentially to $198.7 million from $166.5 million in the first quarter of 2025. Net income (GAAP) decreased to $16.3 million, or $0.49 per diluted American depositary share (“ADS”) (GAAP), from net income (GAAP) of $19.5 million, or $0.58 per diluted ADS (GAAP), in the first quarter of 2025.
For the second quarter of 2025, net income (non-GAAP) increased to $23.0 million, or $0.69 per diluted ADS (non-GAAP), from net income (non-GAAP) of $20.3 million, or $0.60 per diluted ADS (non-GAAP), in the first quarter of 2025.
All financial numbers are in US dollars unless otherwise noted.
Second Quarter of 2025 Review
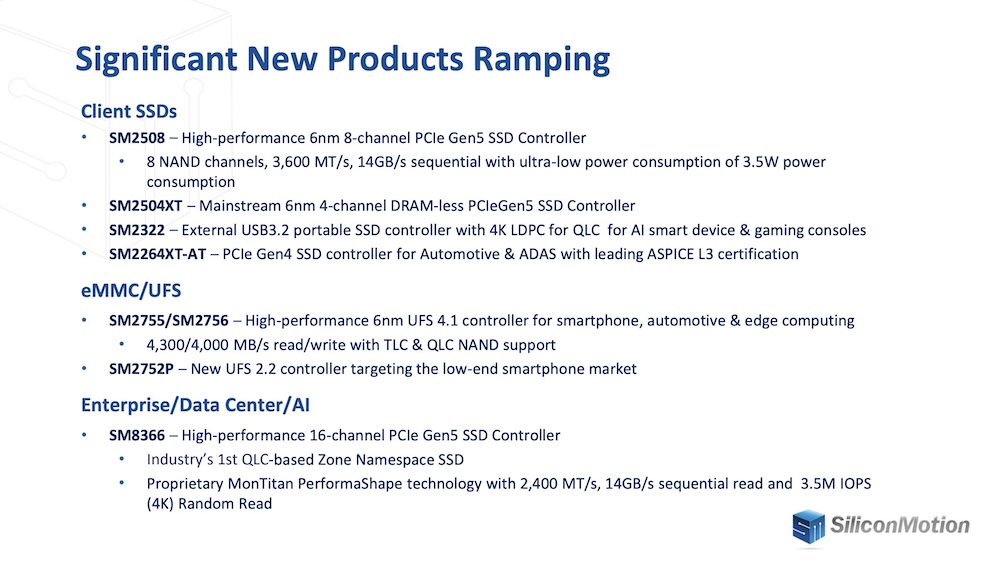
“We experienced a strong recovery in our business during the second quarter of 2025 and delivered revenue well above our previously provided range,” stated Wallace Kou, president and CEO, Silicon Motion. “Our industry leading PCIe5 client SSD controller sales grew more than 75% quarter-over-quarter as AI-at-the-edge PCs are beginning to gain market traction and as white box AI server makers continue to leverage mainstream hardware components. Our eMMC and UFS products experienced strong growth during the second quarter of 2025, primarily driven by better-than-anticipated smartphone sales and market share gains. We are benefiting from increased product and market diversification and we believe that we are better positioned to deliver long-term, sustainable growth due to our expanding portfolio of leading consumer, enterprise, automotive, industrial and storage solutions.“
Key Financial Results
| (in millions, except percentages and per ADS amounts) | GAAP | Non-GAAP | ||||||
| 2Q 2025 | 1Q 2025 | 2Q 2024 | 2Q 2025 | 1Q 2025 | 2Q 2024 | |||
| Revenue | $198.7 | $166.5 | $210.7 | $198.7 | $166.5 | $210.7 | ||
| Gross profit Percent of revenue |
$94.7 47.7% |
$78.4 47.1% |
$96.8 45.9% |
$94.7 47.7% |
$78.4 47.1% |
$96.8 46.0% |
||
| Operating expenses | $72.4 | $68.6 | $66.0 | $69.3 | $63.6 | $62.1 | ||
| Operating income Percent of revenue |
$22.3 11.2% |
$9.8 5.9% |
$30.7 14.6% |
$25.3 12.8% |
$14.9 8.9% |
$34.7 16.5% |
||
| Earnings per diluted ADS | $0.49 | $0.58 | $0.91 | $0.69 | $0.60 | $0.96 | ||
Other Financial Information
| (in millions) | 2Q 2025 | 1Q 2025 | 2Q 2024 | |
| Cash, cash equivalents and restricted cash—end of period | $282.3 | $331.7 | $343.6 | |
| Routine capital expenditures | $7.4 | $7.0 | $6.3 | |
| Dividend payments | $16.7 | $17.0 | $16.8 | |
| Share repurchases | — | $24.3 | — | |
During the second quarter of 2025, we had $15.6 million of capital expenditures, including $7.4 million for the routine purchases of testing equipment, software, design tools and other items, and $8.2 million for building construction and improvements in Hsinchu, Taiwan.
Returning Value to Shareholders
On October 28, 2024, our Board of Directors declared a $2.00 per ADS annual cash dividend to be paid in quarterly installments of $0.50 per ADS. On May 22, 2025, we paid $16.7 million to Silicon Motion shareholders as the third installment of the annual cash dividend.
On February 6, 2025, we announced that our Board of Directors had authorized a new program for the Company to repurchase up to $50 million of our ADSs over a six-month period. In the second quarter of 2025, we did not repurchase any of our ADSs.
Business Outlook
“Our diversification strategy is expanding our market opportunities as we continue to invest in new products and markets. In 2025, we are benefitting from the introduction of several new products including our leading 6nm, 8-channel PCIe5 client SSD controller, our new eMMC and UFS controllers, and our MicroSD controller that is selling alongside the Nintendo Switch 2. In the second half of the year, we expect to further benefit from the initial ramp of our new 6nm, 4-channel PCIe5 client SSD controller targeting the mass market in late 2025, our first MonTitan enterprise/AI-class product, and our boot drive storage products for DPU network accelerators for the greater SSD storage ecosystem. We expect to ramp each of these products to scale in 2026 with our customers. Additionally, we continue to experience significant design win activity and demand for our leading automotive portfolio, and we expect to benefit from a mix shift to higher ASP products moving forward as customers shift to our growing portfolio of full solutions. We expect a stronger second half of the year, and we continue to target a revenue run rate of $1 billion for 2025 as we exit the year,” stated Mr. Kou.
For the third quarter of 2025, management expects:
| ($ in millions, except percentages) | GAAP | Non-GAAP Adjustment | Non-GAAP |
| Revenue | $219 to $228 +10% to 15% Q/Q |
— | $219 to $228 +10% to 15% Q/Q |
| Gross margin | 48.0% to 49.0% | Approximately $0.1* | 48.0% to 49.0% |
| Operating margin | 8.9% to 11.5% | Approximately $6.5 to $7.5** | 12.3% to 14.3% |
* Projected gross margin (non-GAAP) excludes $0.1 million of stock-based compensation.
** Projected operating margin (non-GAAP) excludes $6.5 million to $7.5 million of stock-based compensation and dispute related expenses.
The company’s management team hosted a conference call on July 31, 2025. A webcast of the call is available on the company’s website.
Discussion of Non-GAAP Financial Measures
To supplement the Company’s unaudited consolidated financial results calculated in accordance with US Generally Accepted Accounting Principles (“GAAP”), the Company discloses certain non-GAAP financial measures that exclude stock-based compensation and other items, including gross profit (non-GAAP), gross margin (non-GAAP), operating expenses (non-GAAP), operating profit (non-GAAP), operating margin (non-GAAP), non-operating income (expense) (non-GAAP), net income (non-GAAP), and earnings per diluted ADS (non-GAAP). These non-GAAP measures are not in accordance with or an alternative to GAAP and may be different from similarly-titled non-GAAP measures used by other companies. We believe that these non-GAAP measures have limitations in that they do not reflect all the amounts associated with the Company’s results of operations as determined in accordance with GAAP and that these measures should only be used to evaluate the Company’s results of operations in conjunction with the corresponding GAAP measures. The presentation of this additional information is not meant to be considered in isolation or as a substitute for the most directly comparable GAAP measure. We compensate for the limitations of our non-GAAP financial measures by relying upon GAAP results to gain a complete picture of our performance.
Our non-GAAP financial measures are provided to enhance the user’s overall understanding of our current financial performance and our prospects for the future. Specifically, we believe the non-GAAP results provide useful information to both management and investors as these non-GAAP results exclude certain expenses, gains and losses that we believe are not indicative of our core operating results and because they are consistent with the financial models and estimates published by many analysts who follow the Company. We use non-GAAP measures to evaluate the operating performance of our business, for comparison with our forecasts, and for benchmarking our performance externally vs. our competitors. Also, when evaluating potential acquisitions, we exclude the items described below from our consideration of the target’s performance and valuation. Since we find these measures to be useful, we believe that our investors benefit from seeing the results from management’s perspective in addition to seeing our GAAP results. We believe that these non-GAAP measures, when read in conjunction with the Company’s GAAP financials, provide useful information to investors by offering:
- the ability to make more meaningful period-to-period comparisons of the Company’s on-going operating results;
- the ability to better identify trends in the Company’s underlying business and perform related trend analysis;
- a better understanding of how management plans and measures the Company’s underlying business; and
- an easier way to compare the Company’s operating results vs. analyst financial models and operating results of our competitors that supplement their GAAP results with non-GAAP financial measures.
The following are explanations of each of the adjustments that we incorporate into our non-GAAP measures, as well as the reasons for excluding each of these individual items in our reconciliation of these non-GAAP financial measures:
Stock-based compensation expense consists of non-cash charges related to the fair value of restricted stock units awarded to employees. The Company believes that the exclusion of these non-cash charges provides for more accurate comparisons of our operating results to our peer companies due to the varying available valuation methodologies, subjective assumptions and the variety of award types. In addition, the Company believes it is useful to investors to understand the specific impact of share-based compensation on its operating results.
Restructuring charges relate to the restructuring of our underperforming product lines, principally the write-down of NAND flash, embedded DRAM and SSD inventory valuation and severance payments.
Dispute related expenses consist of legal, consultant, other fees and resolution related to the dispute.
Foreign exchange loss (gain) consists of translation gains and/or losses of non-US$ denominated current assets and current liabilities, as well as certain other balance sheet items, which result from the appreciation or depreciation of non-$ currencies vs. the US$. We do not use financial instruments to manage the impact on our operations from changes in foreign exchange rates, and because our operations are subject to fluctuations in foreign exchange rates, we therefore exclude foreign exchange gains and losses when presenting non-GAAP financial measures.
Realized/Unrealized loss (gain) on investments relates to the disposal and net change in fair value of long-term investments.


Comments
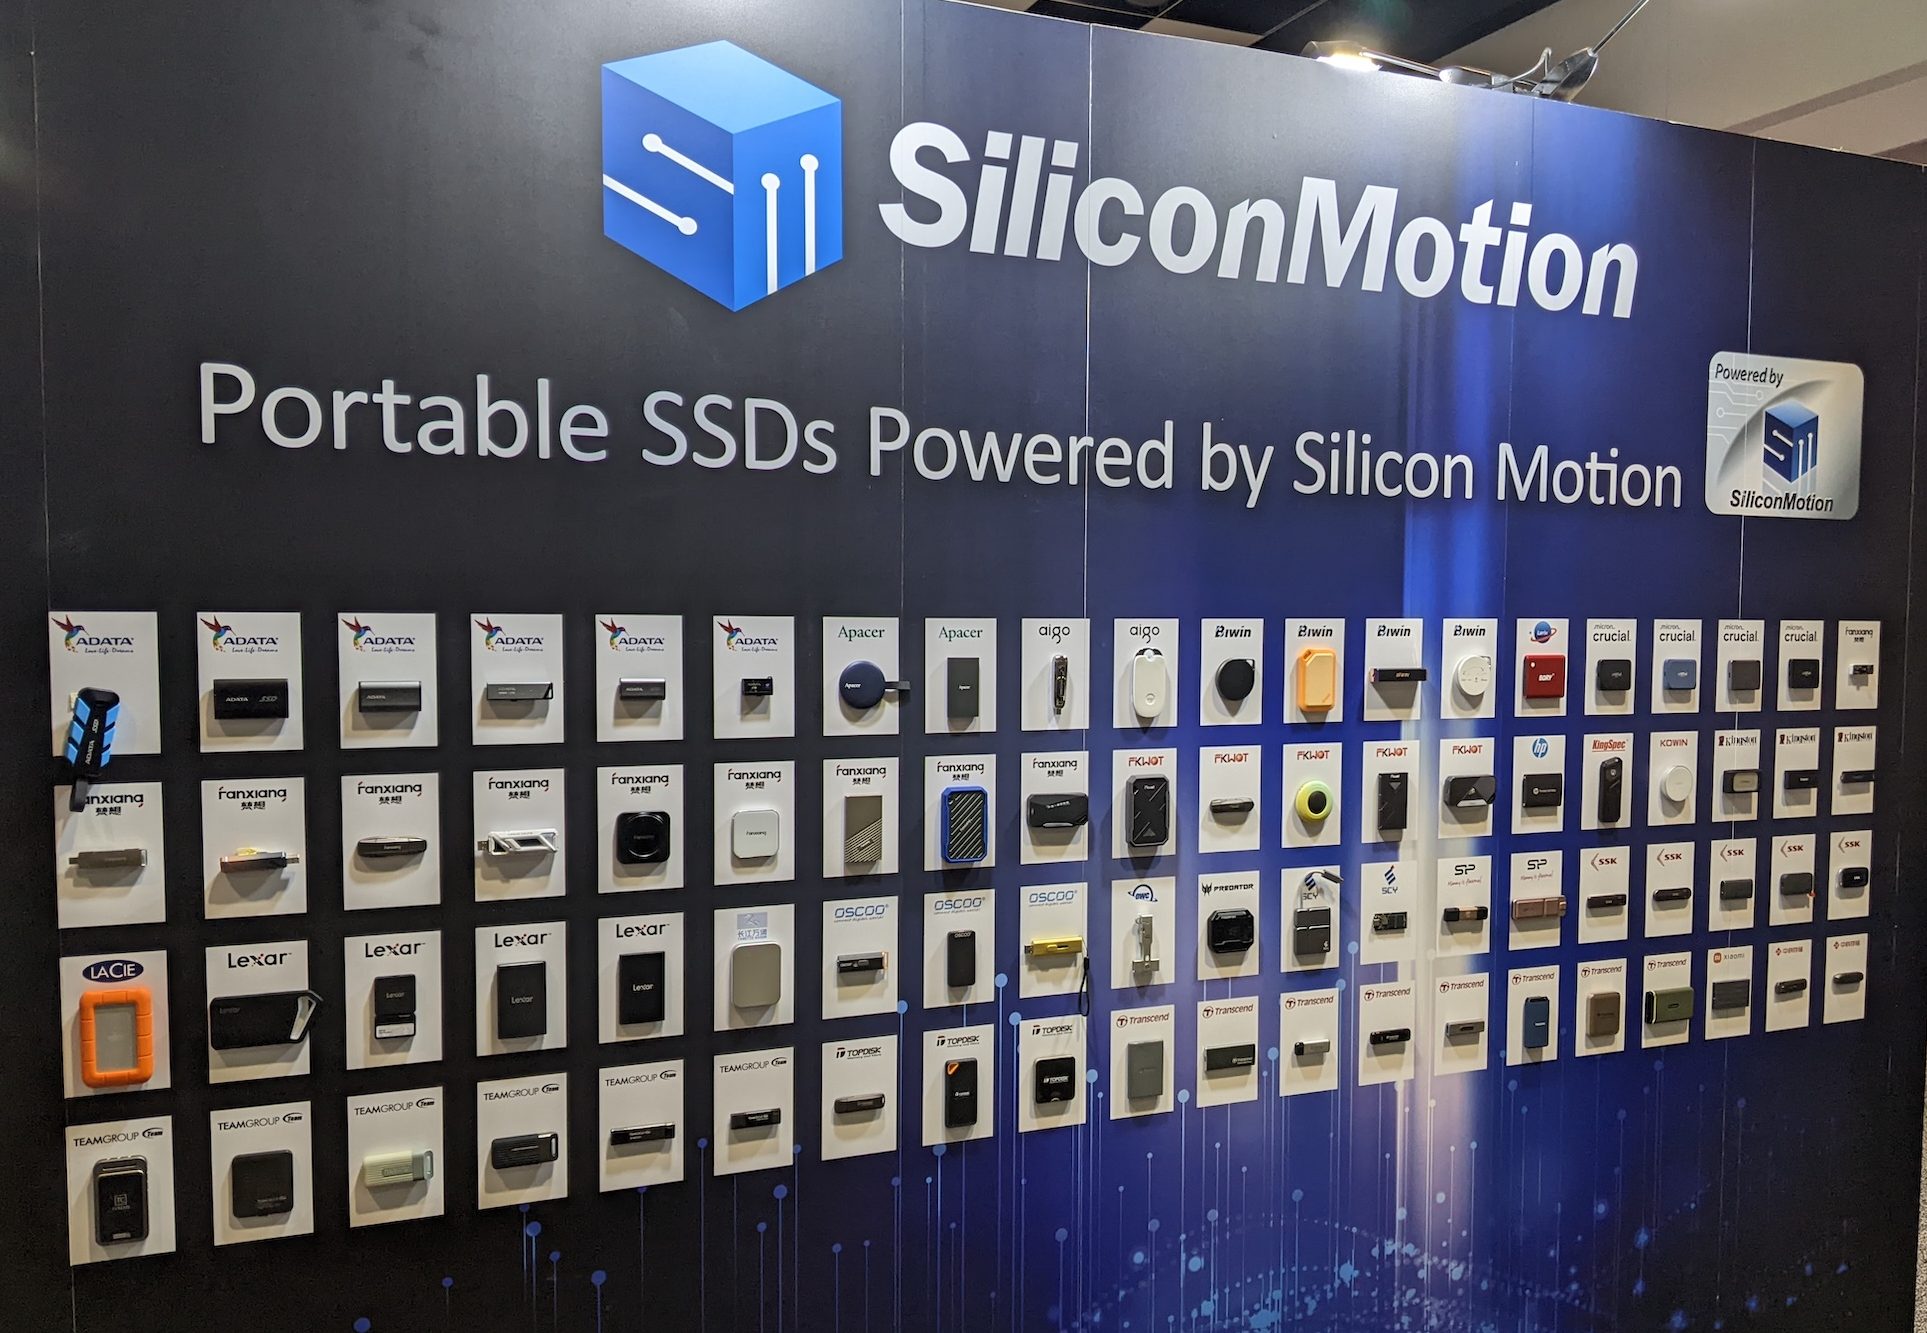
The business has confirmed the good market reception of PCIe Gen 5 client SSD controllers both in 4 and 8 channels plus eMMC, UFS and MicroSSD controllers. MonTitan has received some interests.
Click to enlarge
On the revenue side, 2Q25 at $198 million shows a 19% growth sequentially but a drop of 6% YoY. For the first 6 months 2025, the revenue drops to $365 million coming from $399 million last year meaning a reduction of 8.5%.
Click to enlarge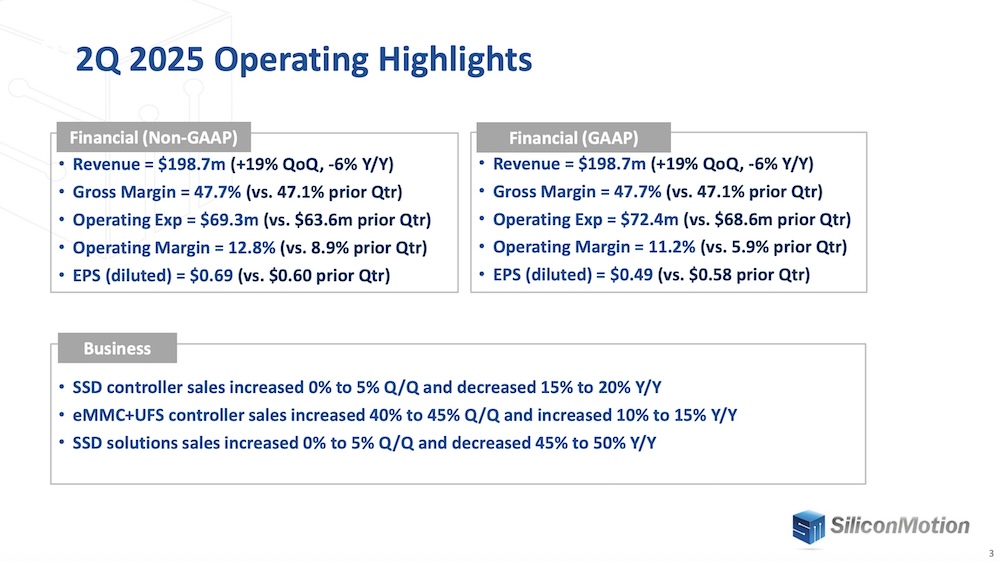
Click to enlarge
 We also remember the deal that has collapsed between MaxLinear and Silicon Motion, it was 2 years ago.
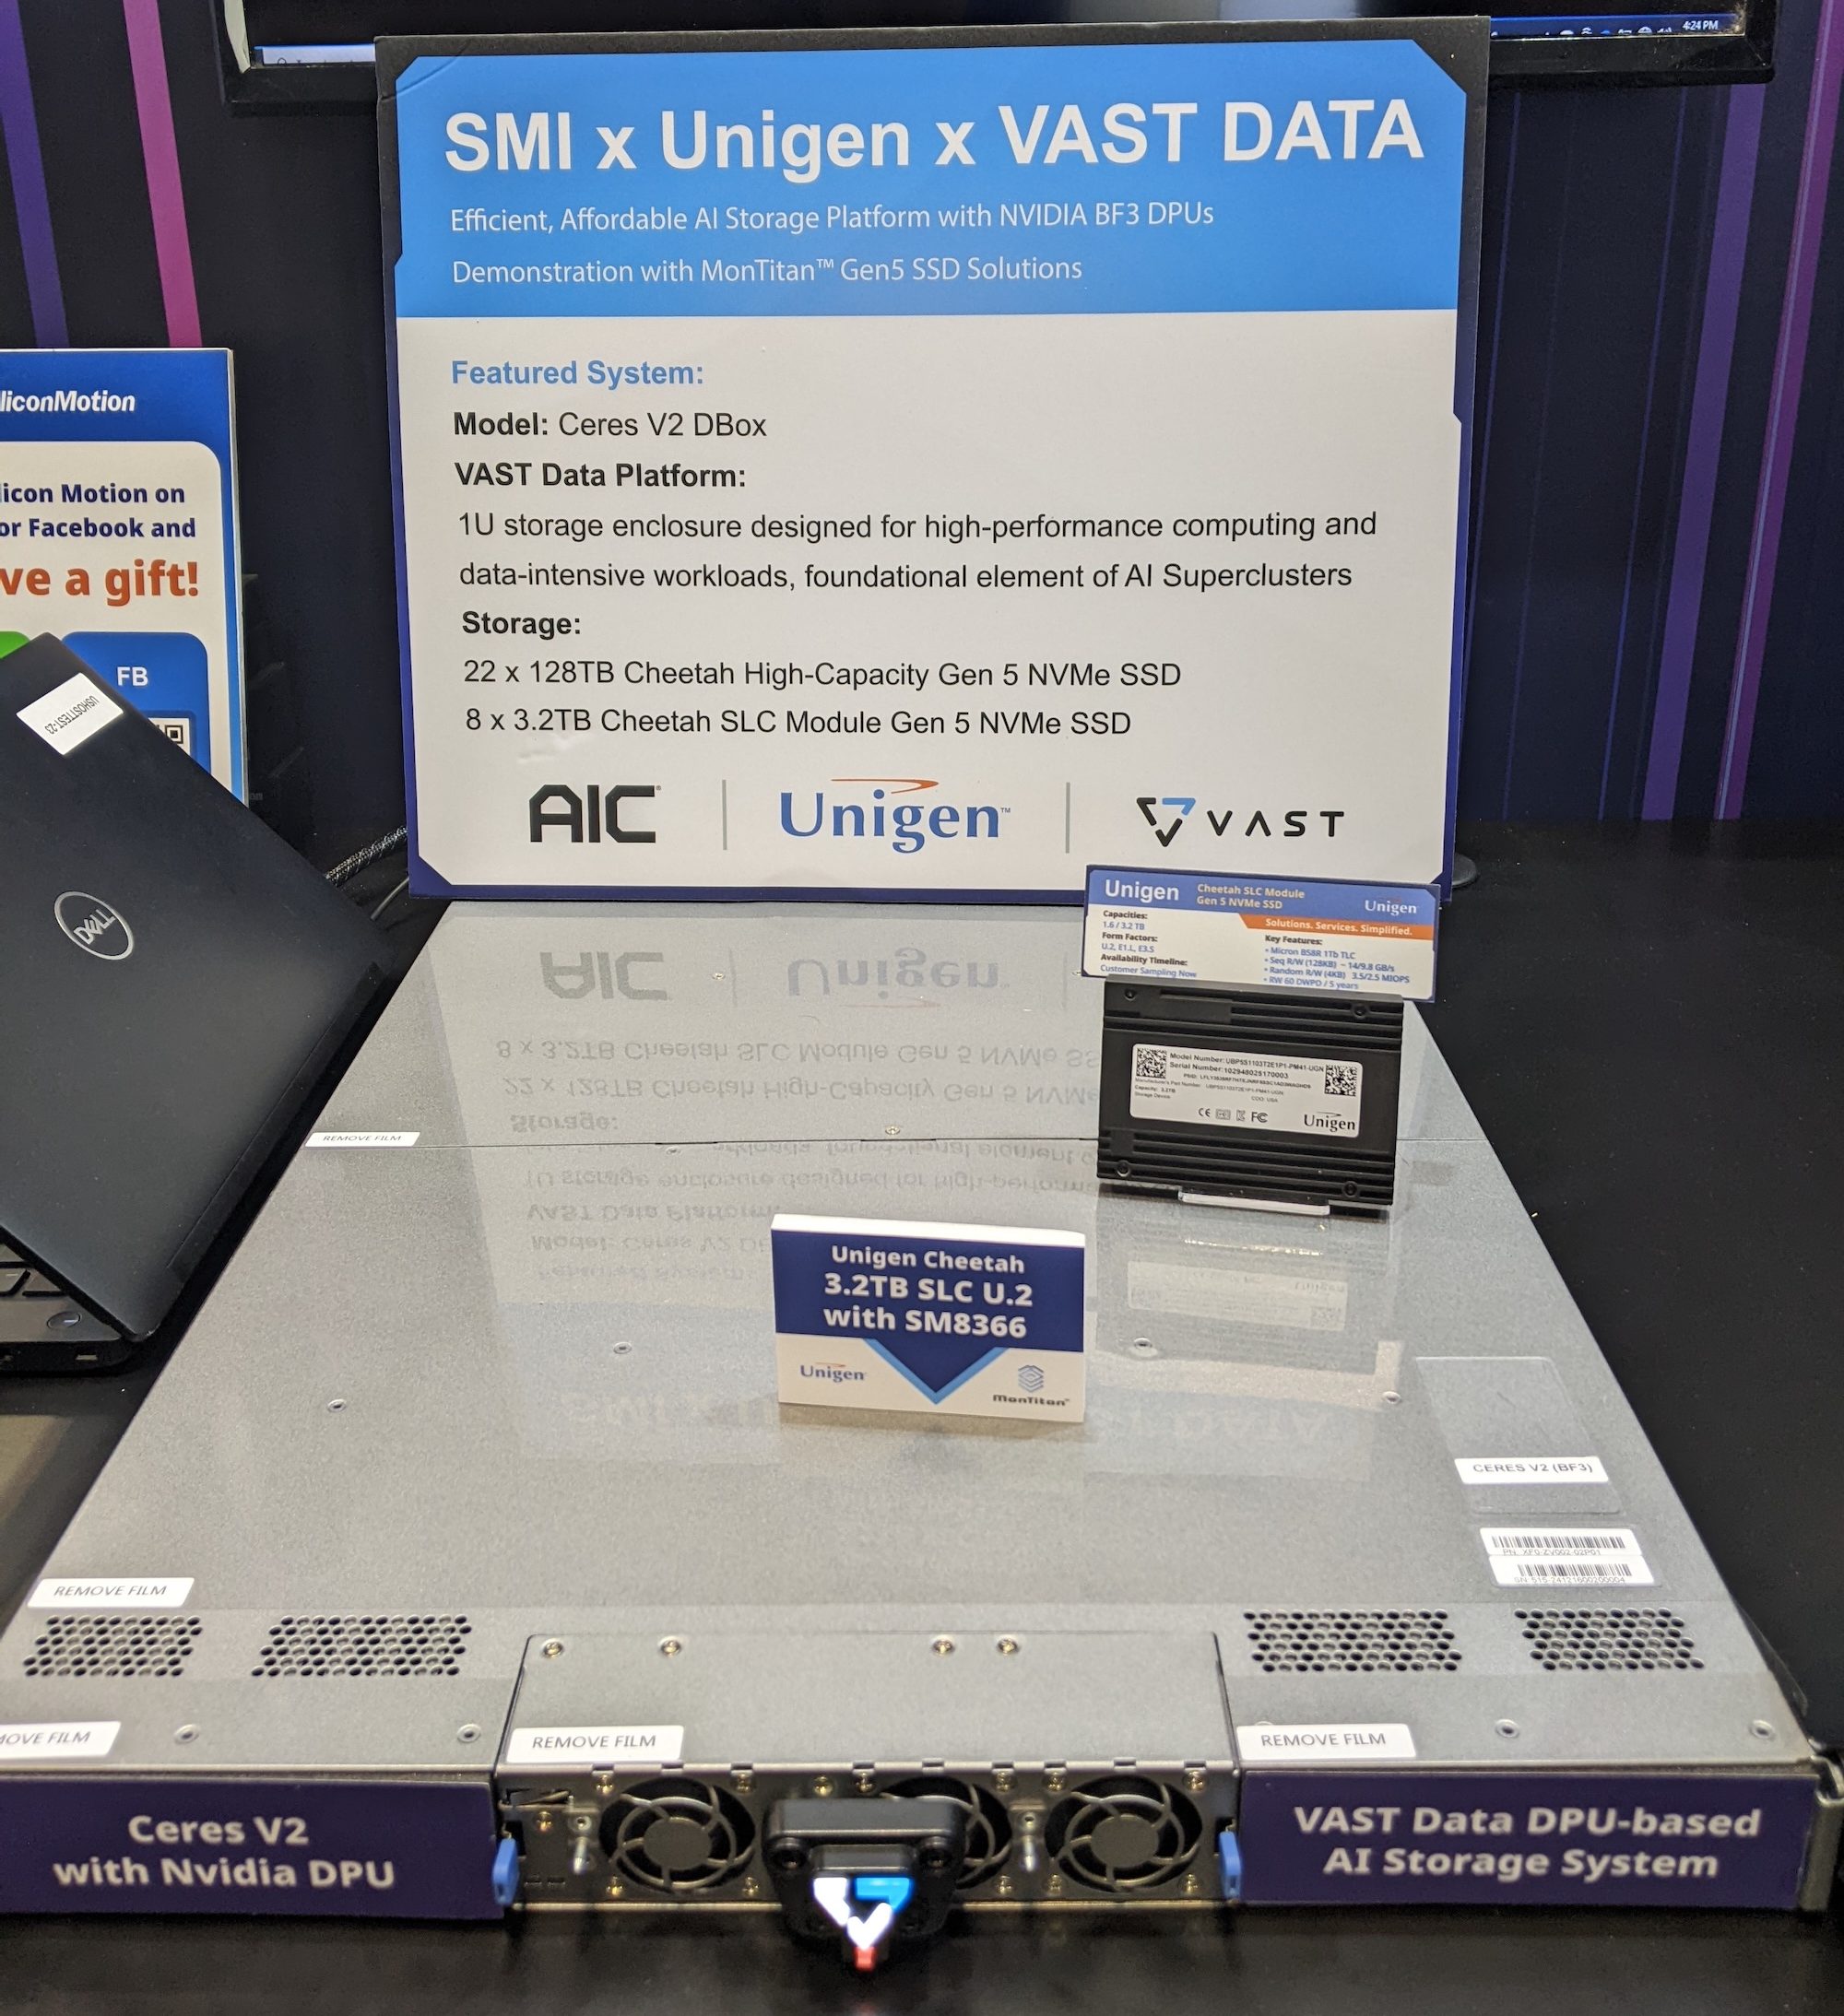
During the recent FMS conference, we also discovered on the Silicon Motion booth an interesting configuration showing MonTitan SM8366 PCIe Gen5 SSD controller coupled with AIC, Unigen and VAST Data elements considering Cheetah high capacity 128TB QLC E1.L SSD for the back-end storage and Cheetah 3.2TB SLC U.2 SSD for SCM like approach need for the VAST Data DASE model.
Click to enlarge


 Subscribe to our free daily newsletter

