One Stop Systems: Fiscal 2Q25 Financial Results
Revenue of $14.1 million, Up 6.9% Y/Y, net loss of $2.0 million, company anticipates revenue of $59-$61 million for FY25.
This is a Press Release edited by StorageNewsletter.com on August 13, 2025 at 2:02 pmSummary:
- Second quarter of 2025 consolidated gross margin increased over 600 basis points Y/Y to 31.3%, on consolidated revenue of $14.1 million
- OSS segment gross margin of 41.3%, on OSS segment revenue of $5.8 million
- Year-to-date OSS segment bookings of $25.4 million, supports outlook for accelerating revenue growth and improving profitability for the second half of 2025
One Stop Systems, Inc. reported results for the second quarter ended June 30, 2025.

Second-quarter and 6-month comparisons are to the same year-ago periods unless otherwise noted.
“The performance of our OSS segment in the first half of the year demonstrates the meaningful progress we have made repositioning the Company for sustained growth,” stated Mike Knowles, president and CEO. “We are successfully converting our large, multi-year pipeline into orders, while making strategic investments in R&D. Year-to-date, our OSS segment has generated one of the highest levels of bookings in our history, totaling $25.4 million and representing a book-to-bill ratio of 2.3x. This strong start to 2025 underscores the solid foundation we have built as we capitalize on increasing demand from both defense and commercial customers for our rugged, enterprise compute solutions.“
“Recent sales and gross margin trends give us growing confidence that our strategy is working and that positive momentum is building. We believe the second half of the year will mark a meaningful inflection point for OSS, with accelerating revenue growth and improving profitability as our business scales to meet rising market demand,” concluded Mr. Knowles.
2025 Second-Quarter Financial Summary
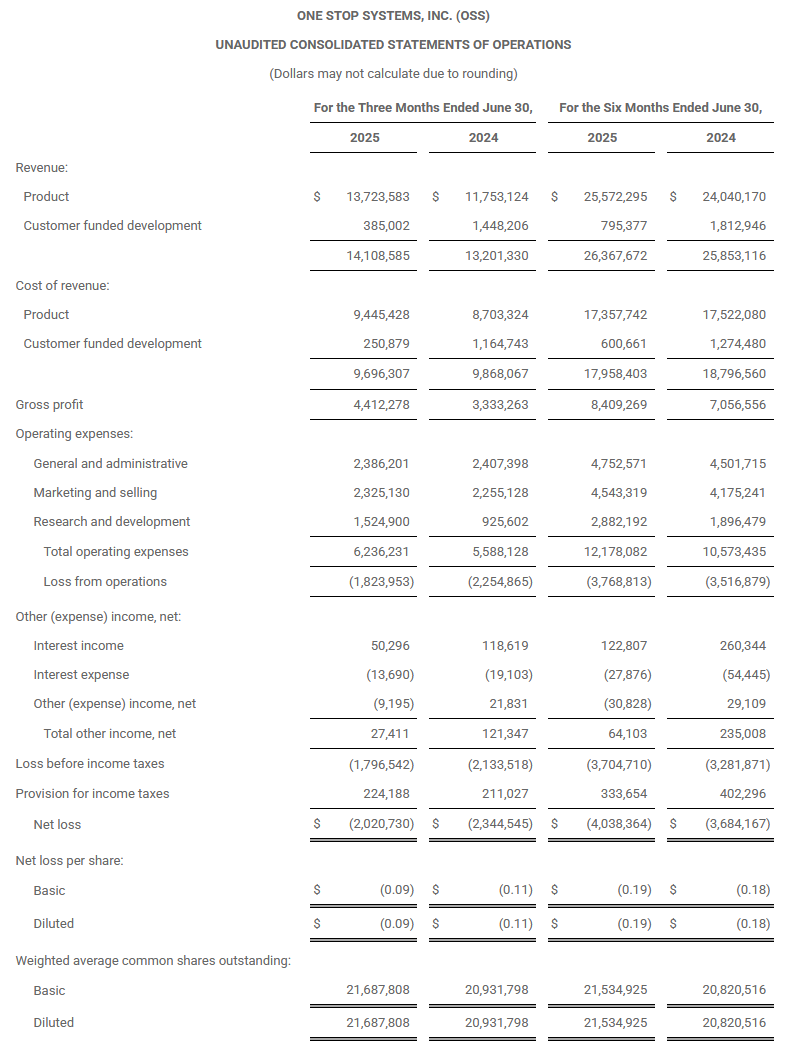
Consolidated revenue increased 6.9% to $14.1 million, from $13.2 million in the second quarter of 2024.
OSS segment revenue increased 4.3%, as compared to the same period in 2024. The increase was primarily due to higher revenues related to the development and production of custom server products for a defense customer, higher shipments of storage products to a US government customer, and the initiation of shipments of server products to a medical device customer.
Bressner segment revenue increased 8.7%, as compared to the same period in 2024.
The following table sets forth net revenue by segment for the 3 months ended June 30, 2025, and June 30,2024 (Dollars may not calculate due to rounding):

Consolidated gross margin was 31.3% for the 3 months ended June 30, 2025, compared to 25.2% in the prior year quarter. On a segment basis, the OSS segment had a gross margin of 41.3%, an increase of 16.4 percentage points as compared to the prior year of 24.9%. The increase in OSS segment gross margin was due to a more profitable mix of products shipped in the quarter, as well as the non-recurrence of an inventory charge recognized in the prior year quarter. The Company’s Bressner segment had a gross margin percentage of 24.3%, compared to 25.5% in the same period last year, primarily due to the impact of foreign exchange rates.
Total operating expenses increased 11.6% to $6.2 million. This increase was predominantly attributable to higher marketing and selling costs due to an increase in personnel costs from the additions in headcount made during 2024 as well as an increase in R&D costs driven by higher engineering labor to support new product development.
The Company reported a net loss of $2.0 million, or $(0.09) per share for the 3 months ended June 30, 2025, as compared to a net loss of $2.3 million, or $(0.11) per share, in the prior year period. The Company reported a non-GAAP net loss of $1.5 million, or $(0.07) per share, compared to non-GAAP net loss of $1.8 million, or $(0.09) per share.
Adjusted EBITDA, a non-GAAP metric, was a loss of $1.0 million for the 3 months ended June 30, 2025, compared to adjusted EBITDA loss of $1.4 million in the prior year period.
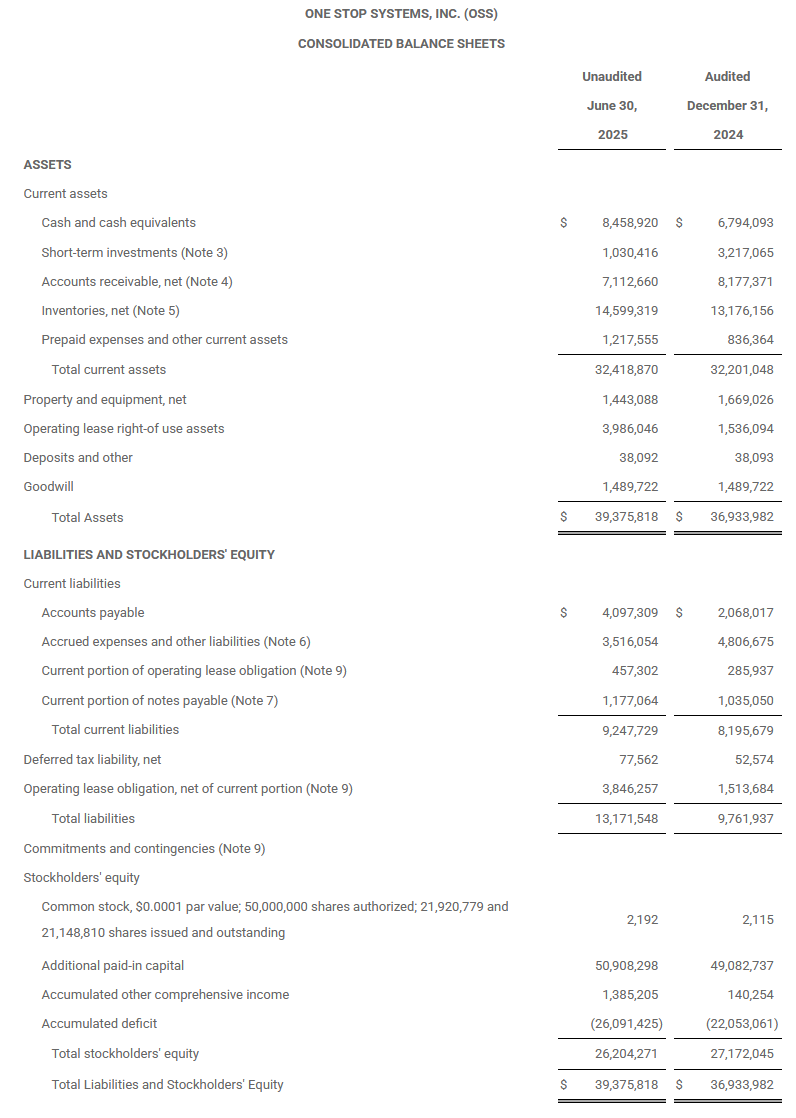
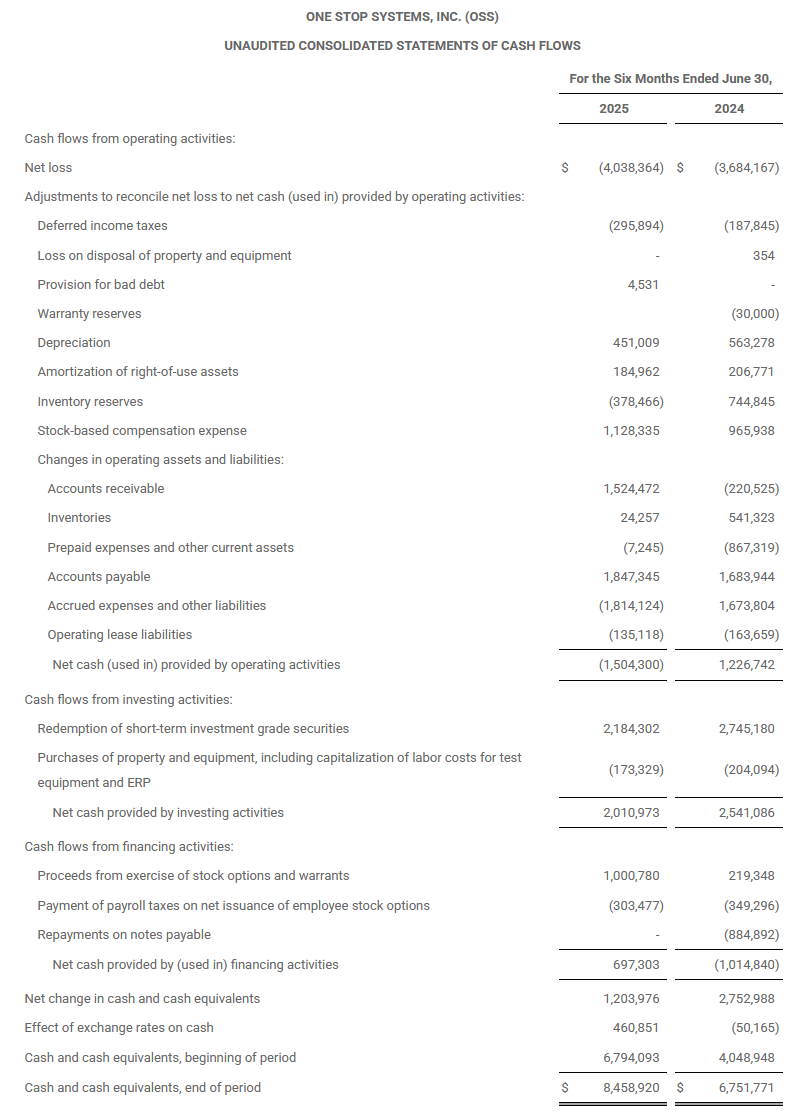
As of June 30, 2025, the Company reported cash and short-term investments of $9.5 million and total working capital of $23.1 million, compared to cash and short-term investments of $10.0 million and total working capital of $24.0 million at December 31, 2024.
2025 First-Half Financial Summary
Consolidated revenue was $26.4 million, compared to $25.9 million for the same period last year. The Company’s OSS segment saw a decrease in revenue of $88,000, or 0.8%. This decrease was primarily driven by lower volume of revenue to a commercial aerospace customer, partially offset by higher volume of revenue to a defense customer and a medical device customer. Bressner experienced an increase in revenue of $603,000, or 4.1%, as compared to the same period in 2024, due to higher book-and-ship revenue in the period, as well as the impact of foreign exchange rates.
The following table sets forth net revenue by product category for the 6 months ended June 30, 2025, and June 30, 2024, by segment:

Consolidated gross margin was 31.9%, as compared to 27.3% in the same year-ago quarter. OSS segment gross margin was 43.3%, an increase of 13.7 percentage points from the same period a year ago. Bressner segment gross margin was 23.8%, as compared to 25.6% in the same period in 2024.
Total operating expenses increased 15.2% to $12.2 million. This increase was predominantly attributable to higher personnel costs, impact of foreign exchange rates, and higher R&D expenses due to higher engineering costs to support targeted investments in new product development.
OSS reported a net loss of $4.0 million, or $(0.19) per share, as compared to a net loss of $3.7 million, or $(0.18) per share, in the prior year. The Company reported a non-GAAP net loss of $2.9 million, or $(0.14) per share, compared to non-GAAP net loss of $2.7 million, or $(0.13) per share.
Adjusted EBITDA, a non-GAAP metric, was a loss of $2.2 million, a decrease from an adjusted EBITDA loss of $1.9 million in the prior year.
2025 Full Year Outlook
The Company is executing a strategic plan targeting both commercial and defense markets within its OSS segment, aiming to provide integrated solutions and establish OSS as a platform incumbent on large, multi-year programs. This approach is expected to drive long-term value by increasing predictable, recurring revenue and building a strong, multi-year backlog.
During the first half of 2025, bookings in the company’s OSS segment were $25.4 million, which included orders from new and existing customers. These orders are expected to contribute to OSS segment revenue in the second half of 2025 and into 2026.
The company continues to anticipate consolidated revenue of $59 million to $61 million for the full year of 2025. This includes expected OSS segment revenue of approximately $30 million, representing over 20% Y/Y growth. In addition, the Company expects to be EBITDA break-even for the full year of 2025
OSS held a conference call on August 7th to discuss its results for the 2nd quarter of 2025.
A replay is available:
Toll-free replay: 1-844-512-2921
International replay: 1-412-317-6671
Passcode: 11159702
Non-GAAP Financial Measures
We believe that the use of adjusted earnings before interest, taxes, depreciation and amortization, or adjusted EBITDA, is helpful for an investor to assess the performance of the Company. The Company defines adjusted EBITDA as income (loss) before interest, taxes, depreciation, amortization, acquisition expense, impairment of long-lived assets, financing costs, government funded programs, fair value adjustments from purchase accounting, stock-based compensation expense, and expenses related to discontinued operations.
Adjusted EBITDA is not a measurement of financial performance under generally accepted accounting principles in the US, or GAAP. Because of varying available valuation methodologies, subjective assumptions and the variety of equity instruments that can impact a company’s non-cash operating expenses, we believe that providing a non-GAAP financial measure that excludes non-cash and non-recurring expenses allows for meaningful comparisons between our core business operating results and those of other companies, as well as providing us with an important tool for financial and operational decision making and for evaluating our own core business operating results over different periods of time.
Our adjusted EBITDA measure may not provide information that is directly comparable to that provided by other companies in our industry, as other companies in our industry may calculate non-GAAP financial results differently, particularly related to non-recurring and unusual items. Our adjusted EBITDA is not a measurement of financial performance under GAAP and should not be considered as an alternative to operating income or as an indication of operating performance or any other measure of performance derived in accordance with GAAP. We do not consider adjusted EBITDA to be a substitute for, or superior to, the information provided by GAAP financial results.
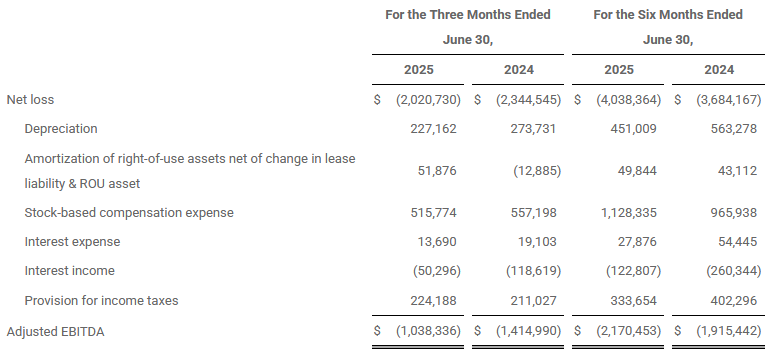
(Dollars may not calculate due to rounding)
Adjusted EPS excludes the impact of certain items and, therefore, has not been calculated in accordance with GAAP. We believe that exclusion of certain selected items assists in providing a more complete understanding of our underlying results and trends and allows for comparability with our peer company index and industry. We use this measure along with the corresponding GAAP financial measures to manage our business and to evaluate our performance compared to prior periods and the marketplace. The Company defines non-GAAP income (loss) as income or (loss) before amortization, government funded programs, impairment of long lived assets, stock-based compensation, expenses related to discontinued operations, and acquisition costs. Adjusted EPS expresses adjusted income (loss) on a per share basis using weighted average diluted shares outstanding.
Adjusted EPS is a non-GAAP financial measure and should not be considered in isolation or as a substitute for financial information provided in accordance with GAAP. These non-GAAP financial measures may not be computed in the same manner as similarly titled measures used by other companies. We expect to continue to incur expenses similar to the adjusted income from continuing operations and adjusted EPS financial adjustments described above, and investors should not infer from our presentation of these non-GAAP financial measures that these costs are unusual, infrequent or non-recurring.
The following table reconciles non-GAAP net income and basic and diluted earnings per share:
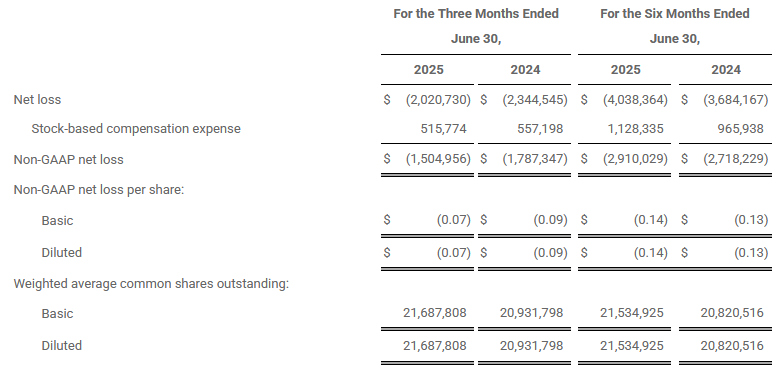
(Dollars may not calculate due to rounding)




 Subscribe to our free daily newsletter

