


 Nutanix: Fiscal 3Q23 Financial Results
Sales up 11% at $449 million, net loss never ending but decreasing at $81 million
This is a Press Release edited by StorageNewsletter.com on May 25, 2023 at 1:02 pm| (in $ million) | 3Q22 | 3Q23 | 9 mo. 22 | 9 mo. 23 |
| Revenue | 403.7 | 448.6 | 1,195 | 1,369 |
| Growth | 11% | 15% | ||
| Net income (loss) | (112.0) | (71.0) | (647.6) | (241.3) |
Highlights:
- Delivers outperformance across all 3FQ23 guided metrics
- Completes audit committee investigation and files form 10-Q for 2FQ23
Nutanix, Inc. announced financial results for its third quarter ended April 30, 2023.
“Our business performed well in 3FQ23 vs. an uncertain macro backdrop, as the value proposition of our cloud platform continued to resonate with customers,” said Rajiv Ramaswami, president and CEO. “We are also pleased to have completed the Audit Committee investigation regarding third-party software usage and to have filed our Form 10-Q for our 2FQ23.”
“Our 3FQ23 results continued to demonstrate a good balance of growth and profitability, resulting in year-to-date ACV Billings growth exceeding 20%, combined with strong year-to-date free cash flow generation,” said Rukmini Sivaraman, CFO. “We continue to execute on our growing base of subscription renewals and remain focused on sustainable, profitable growth.”
Additionally, upon conclusion of its investigation related to third-party software usage, the Audit Committee determined that evaluation software from 2 software providers was used in a non-compliant manner over a multi-year period and that certain employees had concealed this non-compliant use of evaluation software in violation of the code of business conduct and ethics and other policies.
As a result of the investigation, the company also identified a material weakness in its internal control over financial reporting, which resulted in an immaterial understatement of operating expenses and accrued expenses and other current liabilities for prior periods beginning in August 2014. It has accounted for the estimated financial impact of this past non-compliant usage of software from these 2 vendors by recording cumulative estimated expenses of $11 million as of 2FQ23, which represents an estimated amount of future payments for past non-compliant usage of software from these 2 vendors, accrued over a multi-year period. It has accordingly also corrected the prior period financials presented in the Form 10-Q for its 2FQ23 just filed.
The company expects the incremental ongoing annual impact to operating expenses of this third-party software usage to be approximately in the low-single-digit millions of dollars. It is also implementing, or plans on implementing, remedial measures, including remedial measures to address the material weakness and strengthen its overall internal control over financial reporting.
Comments
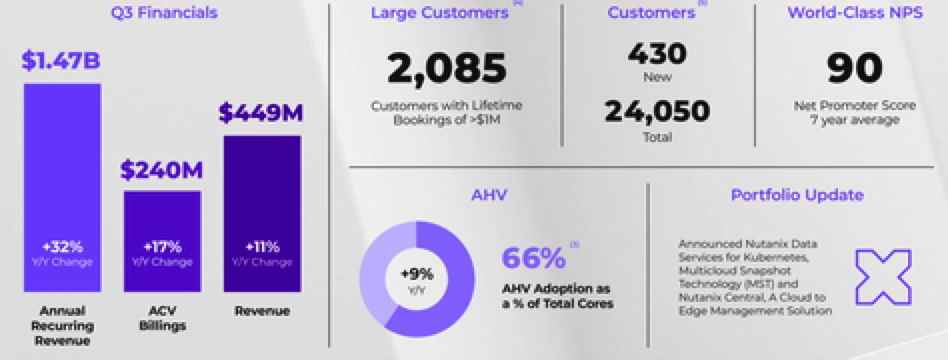
The firm beats all guided metrics. ACV billings in 3FQ23 was $240 million higher than guidance of $220 million to $225 million, and representing a Y/Y growth of 17%. Revenue was $449 million higher than guidance of $430 million to $440 million and a yearly growth of 11%. ARR at the end of 3FQ23 was $1.467 billion, a Y/Y growth of 32%.
New logo additions were 430 in 3FQ23. Average contract duration for this period was 3 years flat Q/Q as expected.
Free cash flow in 3FQ23 was $42 million, implying free cash flow margin of 9%.
Outlook
- For 4FQ23, ACV billings of $240 million to $250 million revenue, sales of $470 million to $480 million
- For FY23 ACV billings of $915 million to $925 million, a Y/Y growth of 22% at the midpoint of the range, revenue of $1.84 billion to $1.85 billion (compared to $1.80 to $1.81 billion announced in 2FQ23), a Y/Y growth of 17% at midpoint.
Revenue and loss of Nutanix
(in $ million)
| FY ended in July |
Revenue | Loss |
| 2012 | 6.6 | 14.0 |
| 2013 | 30.5 | 44.7 |
| 2014 | 127.1 | 84.0 |
| 2015 | 241.4 | 126.1 |
| 2016 | 444.9 | 168.5 |
| 2017 | 845.9 | 379.6 |
| 2018 | 1155 | 297.2 |
| 2019 | 1136 | 621.2 |
| 2020 | 1308 | 872.9 |
| 2021 |
1,394 | 1,034 |
| 1FQ22 | 378.5 | 419.9 |
| 2FQ22 | 413.1 | 115.1 |
| 3FQ22 | 403.7 | 111.6 |
| 4FQ22 | 385.5 | 151.0 |
| FY22 |
1,581 | 797.5 |
| 1FQ23 | 443.6 | 99.1 |
| 2FQ23 | 486.5 | NA |
| 3FQ23 | 448.6 | 71.0 |
| 4FQ23 (estim.) | 470-480 | NA |
| FY23 (estim.) |
1,840-1,850 | NA |
($238 million IPO in 2016)


 Subscribe to our free daily newsletter


