


Peer Insights ‘Voice of the Customer’: HCI Software
On top of list: Dell, Microsoft, Nutanix, Scale Computing and Starwind
This is a Press Release edited by StorageNewsletter.com on December 27, 2022 at 2:01 pmThis market report was published on April 28, 2022 by Gartner, Inc.
Gartner Peer Insights ‘Voice of the Customer’: Hyperconverged Infrastructure Software
By Peer Contributors
Gartner Peer Insights is a free peer review and ratings platform designed for enterprise software and services decision makers. Reviews go through a strict validation and moderation process in an effort to ensure they are authentic.
What Is HCI Software?
It provides virtualized compute, storage, networking and associated (cloud) management – from a single instantiation running on server hardware. Core capabilities for HCI software are virtual compute, storage and networking, using a scale-out, shared-nothing architecture combined with unified, “single pane of glass” management for these virtual resources. Additional core capabilities include local, DAS in each node; enterprise-grade, HA and mobility for both compute and storage; enterprise-grade data services (for example, de-dupe, compression and erasure coding); and some level of choice in server and network hardware.
What Is Peer Insights “Voice of the Customer”?
It is a document that synthesizes Peer Insights’ reviews into insights for IT decision makers. This aggregated peer perspective, along with the individual detailed reviews, is complementary to analyst expert research and can play a key role in your buying process, as it focuses on direct peer experiences of implementing and operating a solution. In this document, only vendors with 20 or more eligible published reviews during the specified 18-month submission period are included. Reviews from end users of companies with less than $50 million in revenue are excluded from this methodology. See the full “Voice of the Customer” methodology here.
Along with the historical peer-based perspective represented in this document, Gartner has a related expert-led Magic Quadrant for the HCI software market.
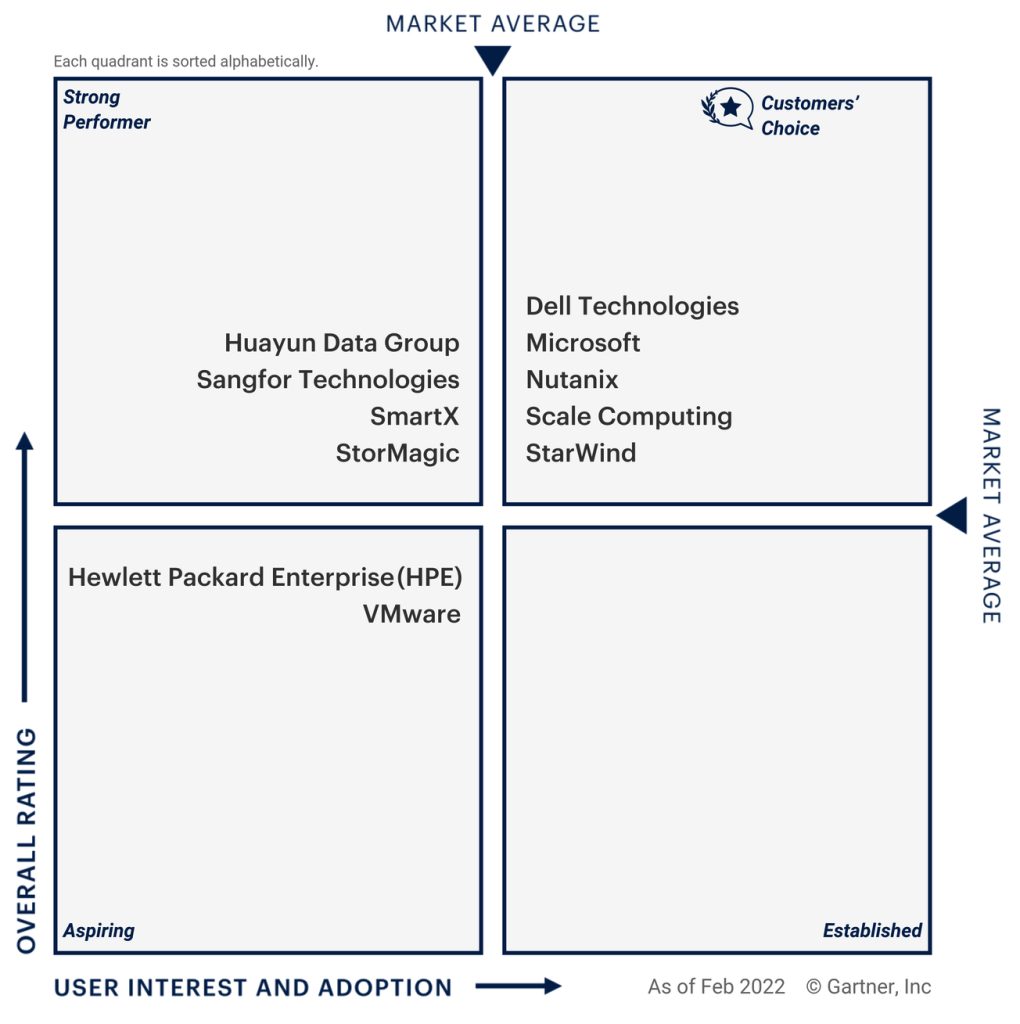
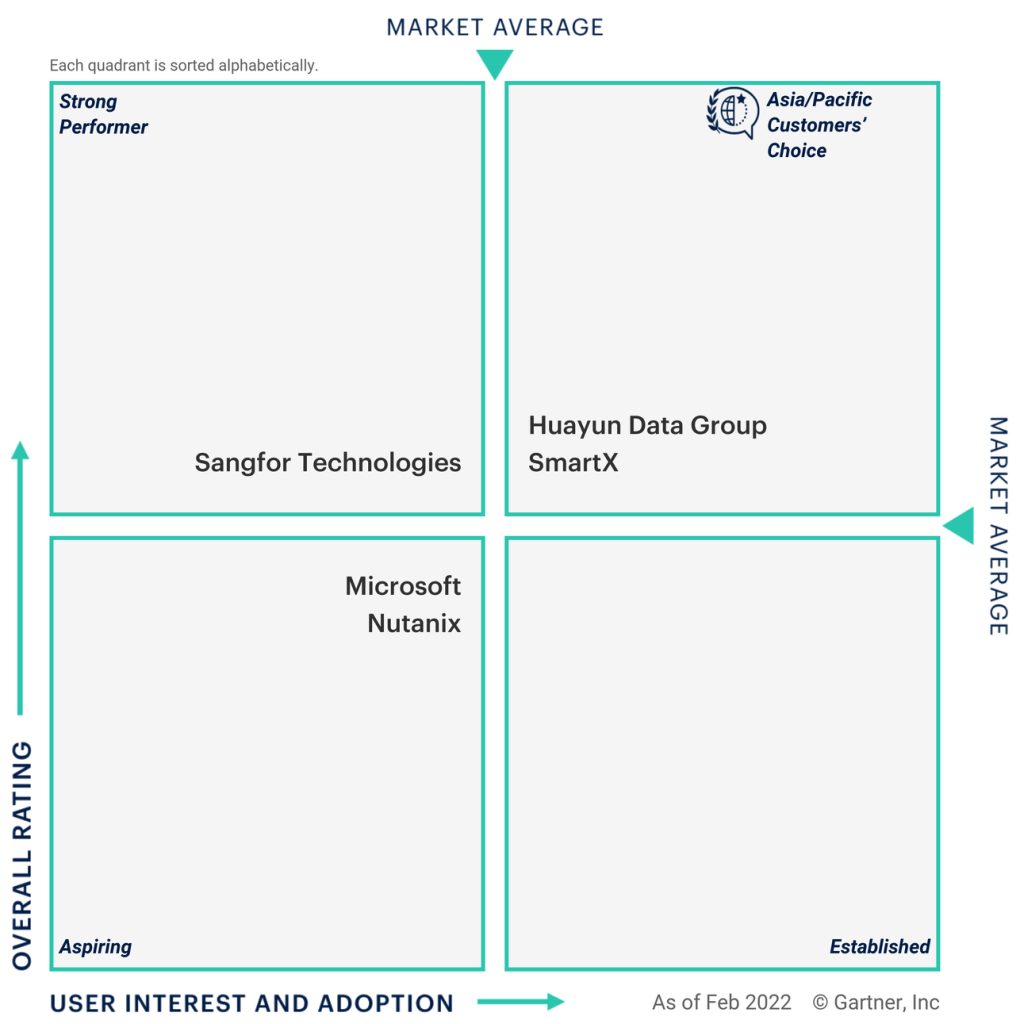
In the HCI software market, Peer Insights has published 1,145 reviews and ratings in the 18-month period ending February 28, 2022. Figure 1 shows all eligible vendors categorized into 4 quadrants based on User Interest and Adoption (X-axis) and Overall Rating (Y-axis). Within each quadrant, vendors are listed in alphabetical order.
Vendors’ User Interest and Adoption scores incorporate 3 factors, each given one-third weight: review volume, user willingness to recommend, and review market coverage across industry, company size, and deployment region. A vendor must meet or exceed the market average User Interest and Adoption Score to qualify for the right-hand quadrants.
The market average Overall Rating is the mean of all eligible vendors’ average Overall Ratings. Vendors must meet or exceed the market average Overall Rating to be positioned in the upper quadrants.
For ease of understanding, each quadrant is labelled as described below. For information on how to evaluate vendors in each quadrant of the “Voice of the Customer” graphic, see the full methodology here.
Vendors placed in the upper-right quadrant of the “Voice of the Customer” quadrants are recognized with the Peer Insights Customers’ Choice distinction, denoted with a Customers’ Choice badge. The recognized vendors meet or exceed both the market average Overall Rating and the market average User Interest and Adoption.
Vendors placed in the lower-right “Established” quadrant of the “Voice of the Customer” meet or exceed the market average User Interest and Adoption but do not meet the market average Overall Rating.
Vendors placed in the upper-left “Strong Performer” quadrant of the “Voice of the Customer” meet or exceed the market average Overall Rating but do not meet the market average User Interest and Adoption.
Vendors placed in the lower-left “Aspiring” quadrant of the “Voice of the Customer” meet neither the market average User Interest and Adoption nor the market average Overall Rating. Like all vendors in this report, their products align to this market and they have met the minimum criteria to be included.
Figure 1. Gartner Peer Insights “Voice of the Customer” HCI Software
HCI Software Peer Reviews and Ratings
In addition to the synthesis provided by the “Voice of the Customer,” you can read individual reviews and ratings on Peer Insights here.
The rest of this document will highlight some key insights for the HCI software market based on 18 months of reviews, and will also point you to particular ways to use the site in your buying process.
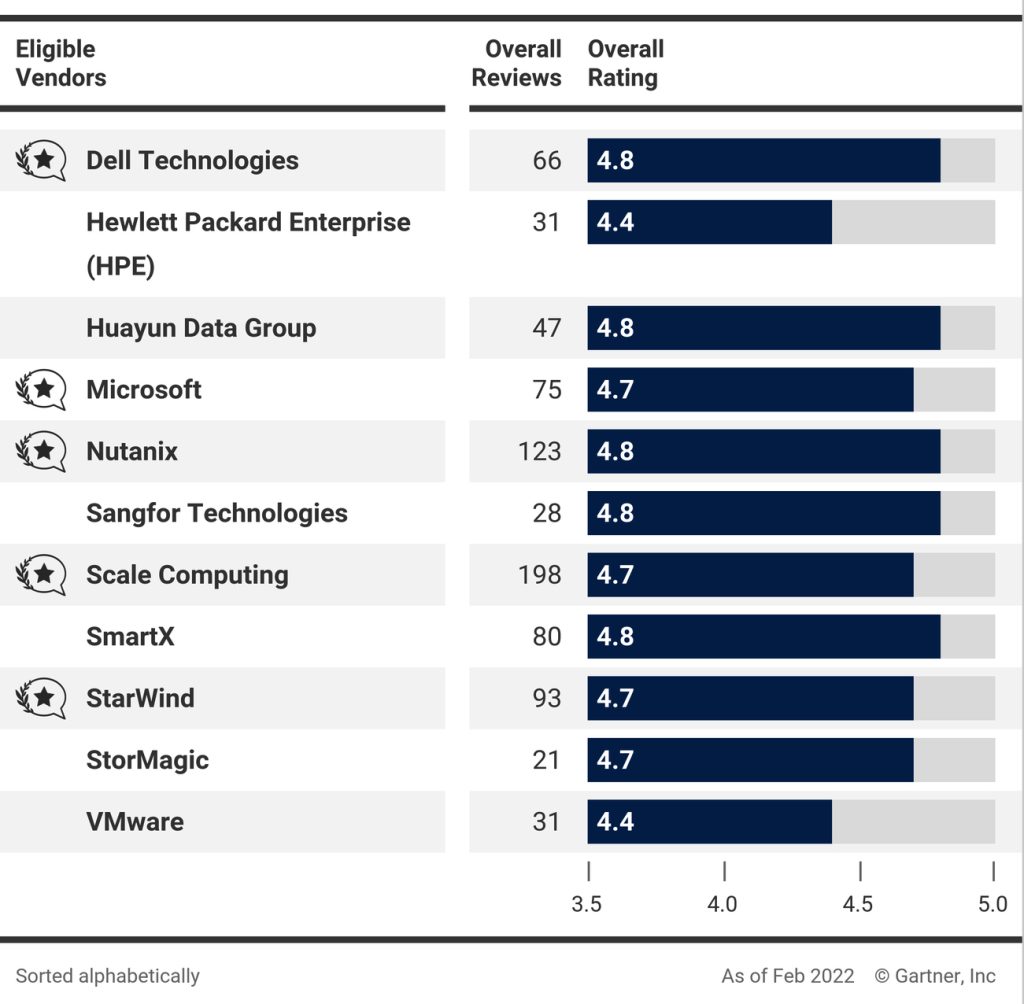
Figure 2 summarizes the Overall Ratings (out of 5 stars) for vendors in the HCI software market that have received more than 20 eligible reviews in the 18-month period ending on February 28, 2022, sorted alphabetically. The Overall Rating is a measure of how satisfied existing customers are with a vendor’s product.
Figure 2. Peer Insights “Voice of the Customer” HCI Software Overall Ratings
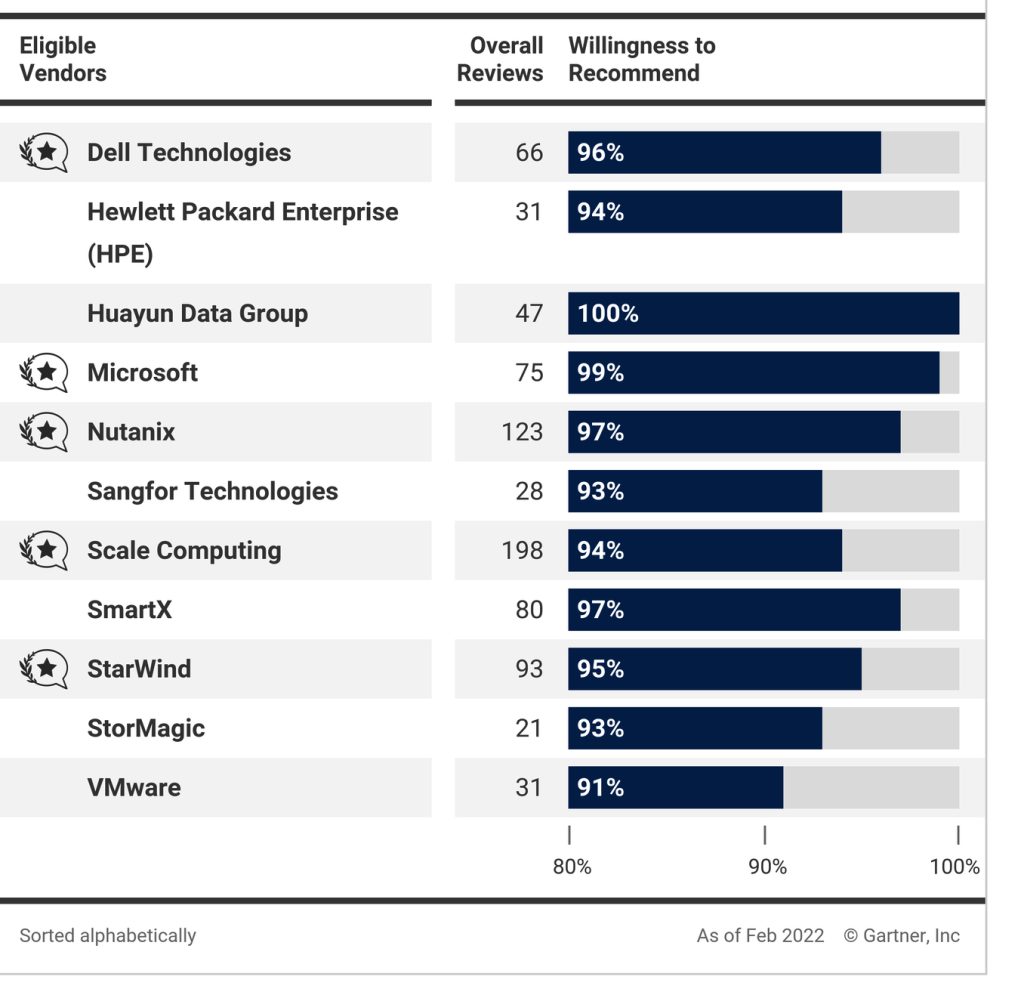
In addition to the Overall Ratings, Peer Insights’ reviews also give insight into end users’ willingness to recommend each vendor. Willingness to recommend is a component of the “Voice of the Customer” X-axis. See methodology here for details. Figure 3 compares vendors by the percentage of reviewers who were willing to recommend them. To create a more detailed comparison between several vendors on your shortlist, click here to go to the Peer Insights market page and press the “Compare Alternatives” button under the vendor/product you are interested in.
Figure 3. Peer Insights “Voice of the Customer” HCI Software Willingness to Recommend
“Voice of the Customer” Segment view
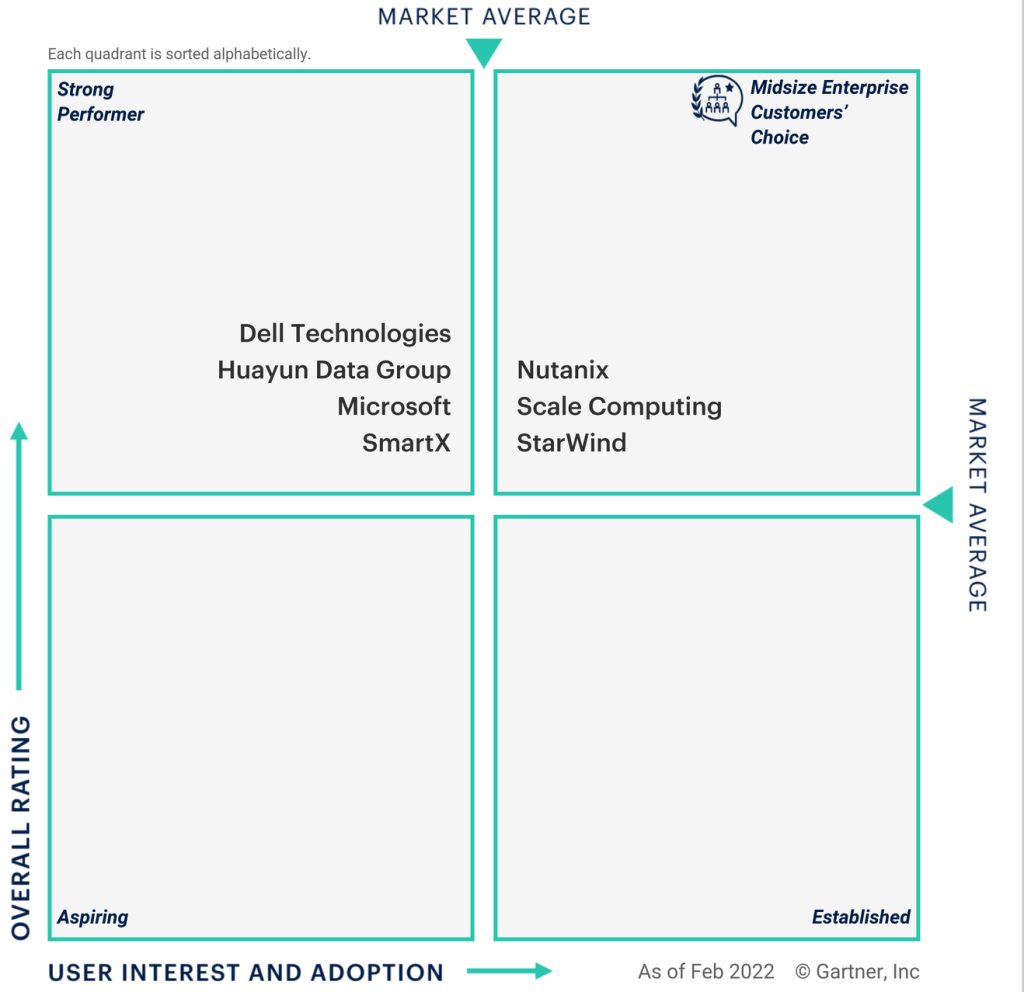
Figure 4 through Figure 5 group vendors in the market under a specific customer segment of industry, deployment region or company size based on the demographics of their reviewers. Peer Insights collects this information from end users’ account profiles and submitted reviews. Only vendors with 20 or more eligible reviews in the segment in the 18-month review period are included. For each segment, vendors are positioned based on the market average Overall Rating on the Y-axis and User Interest and Adoption on the X-axis. User Interest and Adoption is calculated from review count score and willingness to recommend (each weighted 50%). Only reviews from reviewers in the segment are included in the calculations for both axes. Review market coverage is not included in this calculation because each graph refers to one particular segment.
A vendor must meet or exceed the average User Interest and Adoption Score in the segment to qualify for the right-hand quadrants. A vendor must meet or exceed the average Overall Rating in the segment to be positioned in the upper quadrants. Both averages, for Overall Rating and User Interest and Adoption, are calculated using only reviews in the segment for vendors included on the graph.
Vendors placed in the upper-right quadrant of the segment quadrants are recognized through the Customers’ Choice Segment Distinction. The recognized vendors meet or exceed both the average Overall Rating and the average User Interest and Adoption for the segment (see here for details).
Company Size Segment View (by Annual Revenue)
Company Size Segment View (by Annual Revenue)
Figure 4. Peer Insights “Voice of the Customer” HCI Software Midsize Enterprise ($50 million – $1 billion)
Deployment Region Segment View
Figure 5. Peer Insights “Voice of the Customer” HCI Software AsiaPac
Vendor Summaries
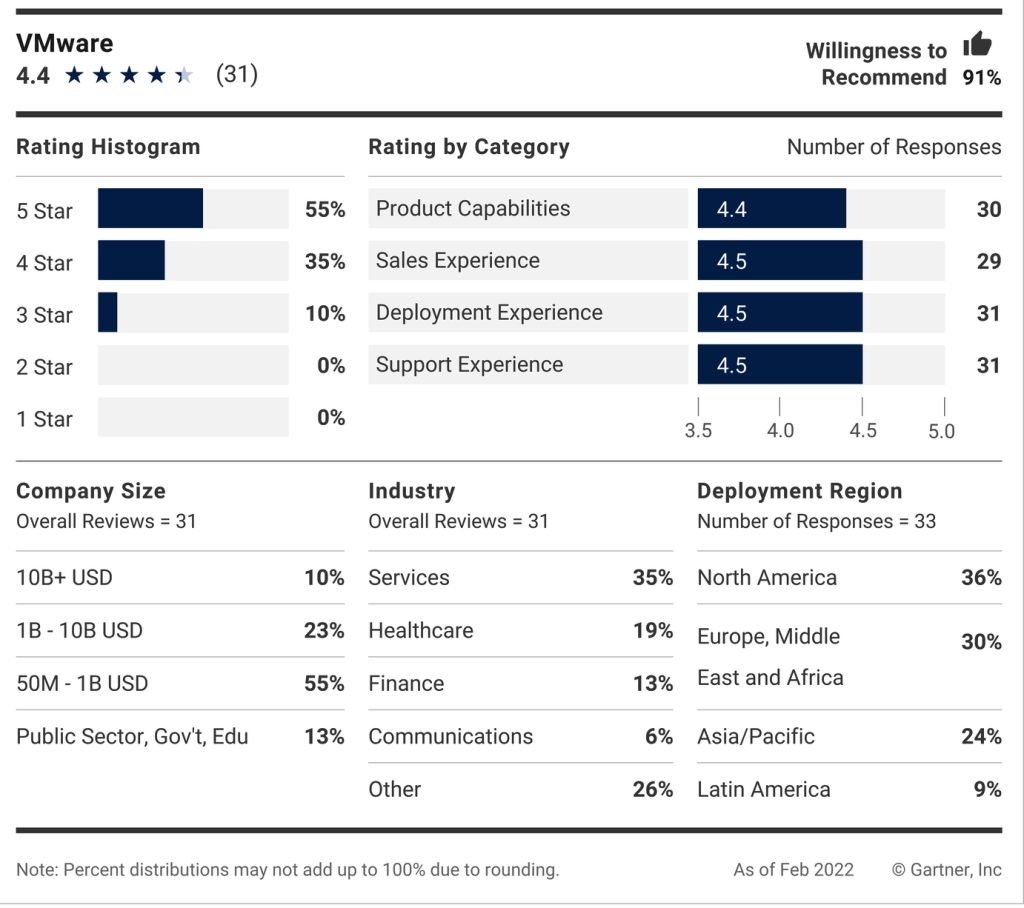
Figures 6 through 16 summarize key information for each vendor included in the “Voice of the Customer”: reviewer demographics for reviews received in the 18-month review period, ending February 28, 2022; Overall Rating and rating distribution; and other ratings covering specific aspects of the experience with the vendor. The same eligibility requirements and weighting used in the “Voice of the Customer” quadrants also apply for ratings in the vendor summary figure, including overall star rating, willingness to recommend, and rating by category (see methodology page here for details). Below each image is a direct link to the user reviews on the Peer Insights site.
Figure 6. Peer Insights “Voice of the Customer” HCI Software Dell Technologies Vendor Summary
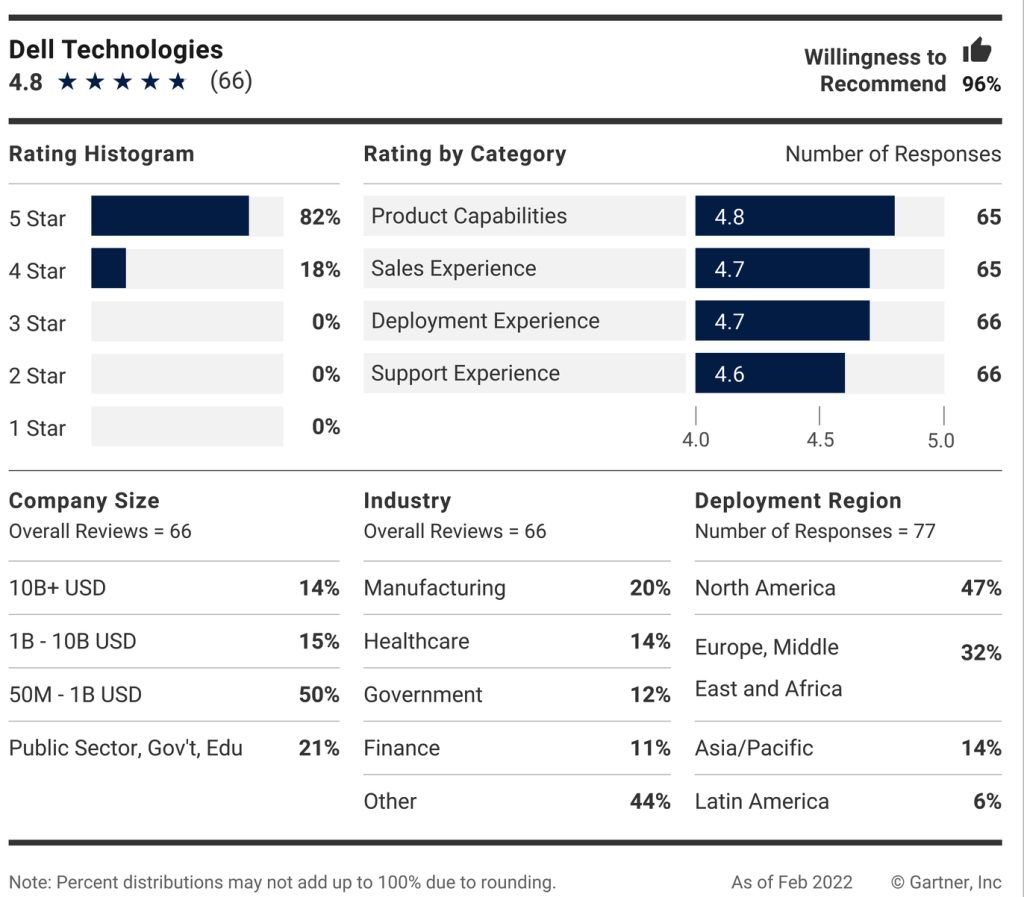
Figure 7. Peer Insights “Voice of the Customer” HCI Software HPE Vendor Summary
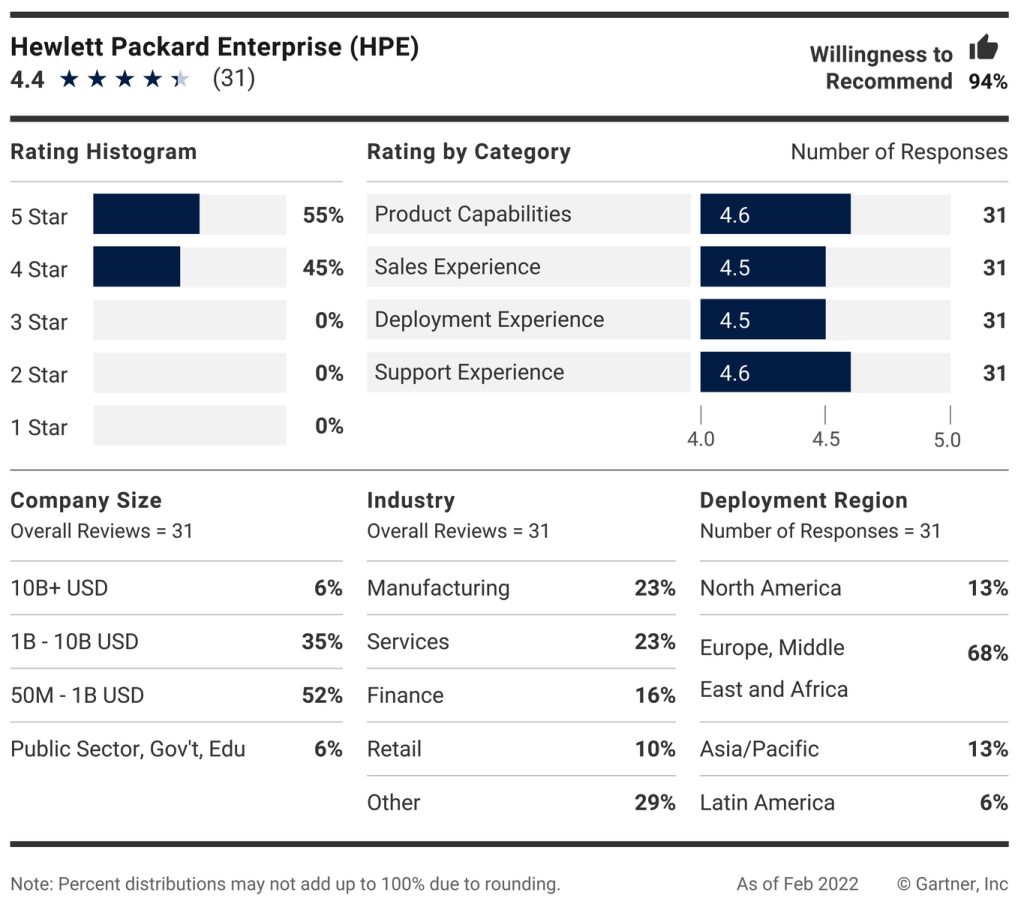
Figure 8. Peer Insights “Voice of the Customer” HCI Software Huayun Data Group Vendor Summary
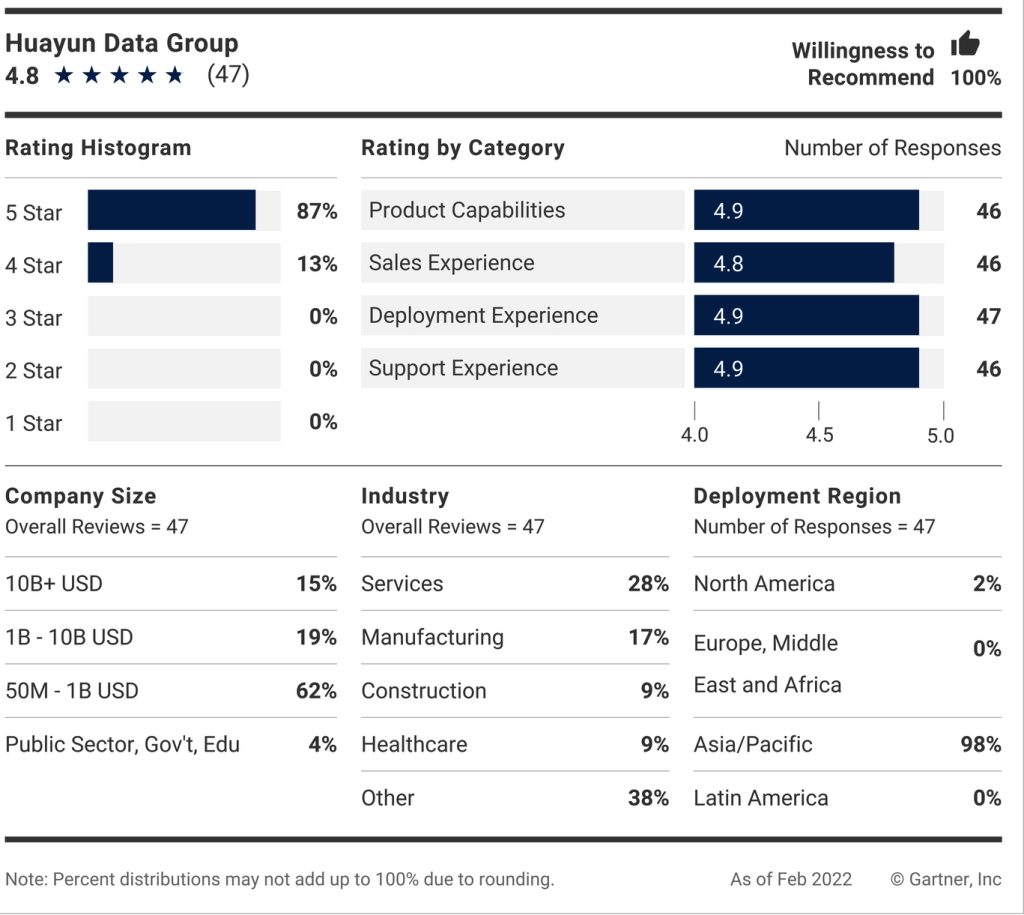
Figure 9. Peer Insights “Voice of the Customer” HCI Software Microsoft Vendor Summary
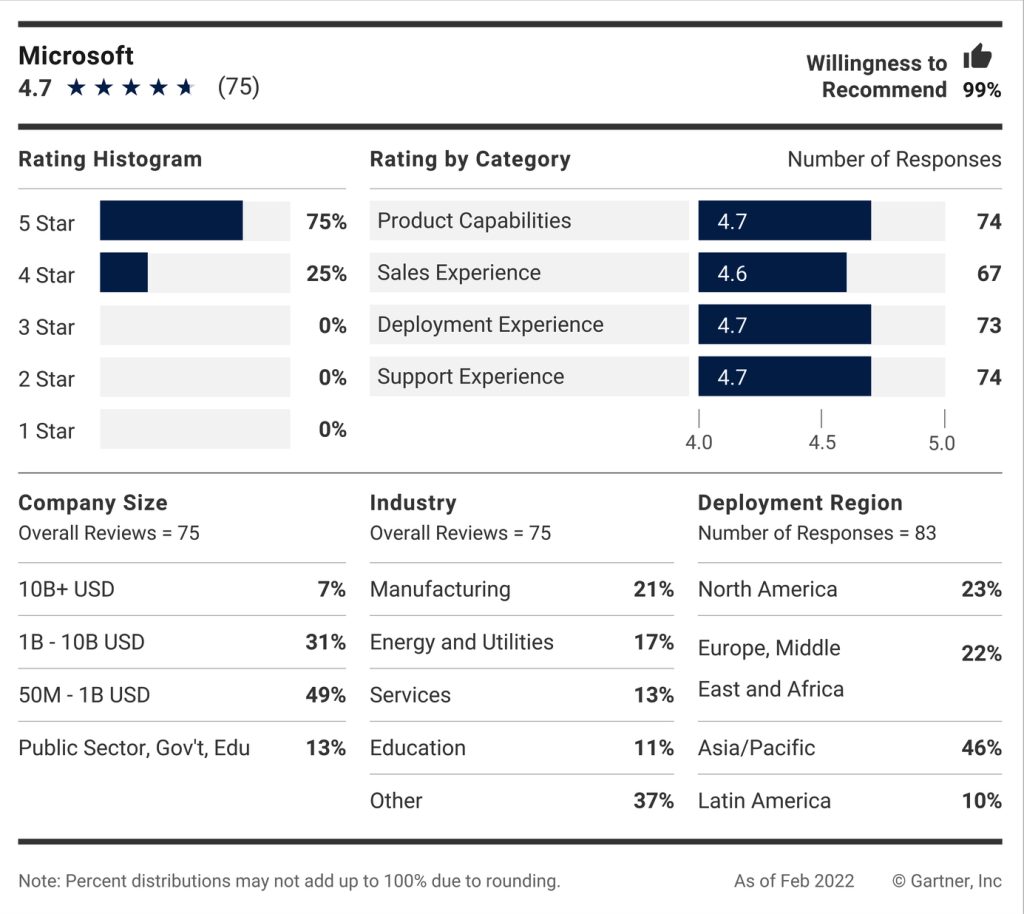
Figure 10. Peer Insights “Voice of the Customer” HCI Software Nutanix Vendor Summary
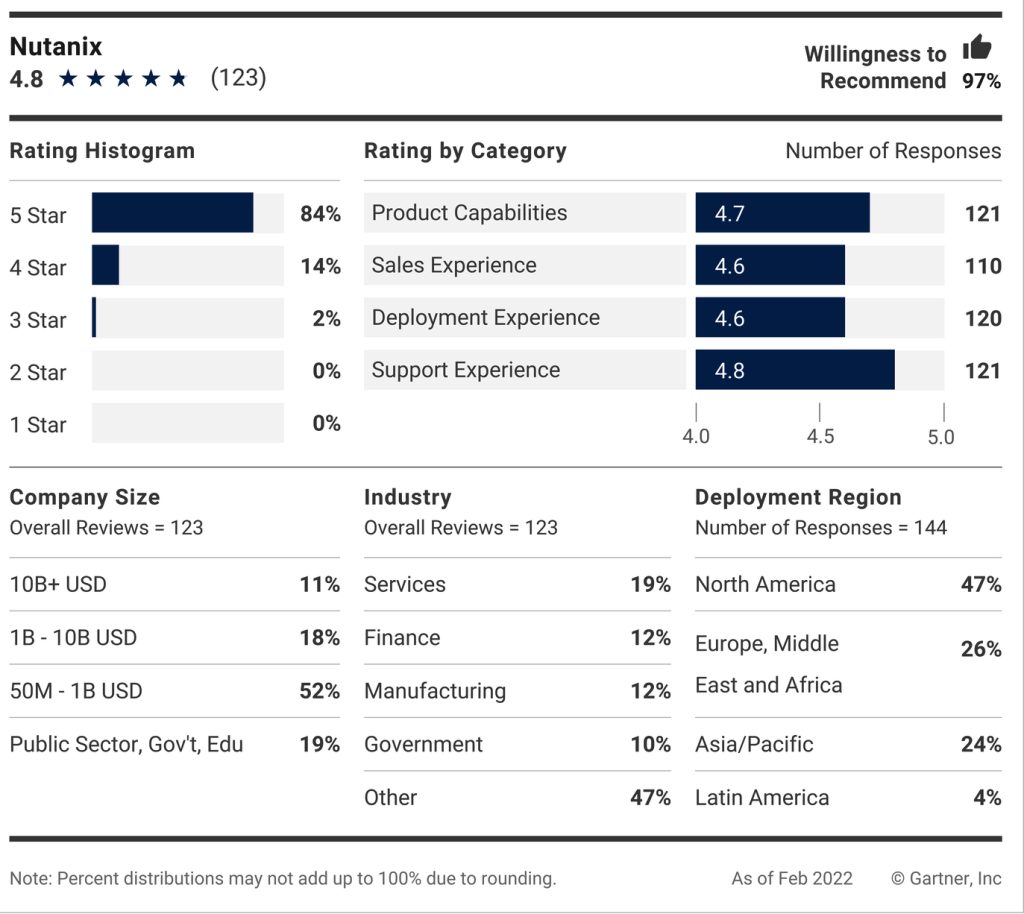
Figure 11. Peer Insights “Voice of the Customer” HCI Software Sangfor Technologies Vendor Summary

Figure 12. Peer Insights “Voice of the Customer” HCI Software Scale Computing Vendor Summary
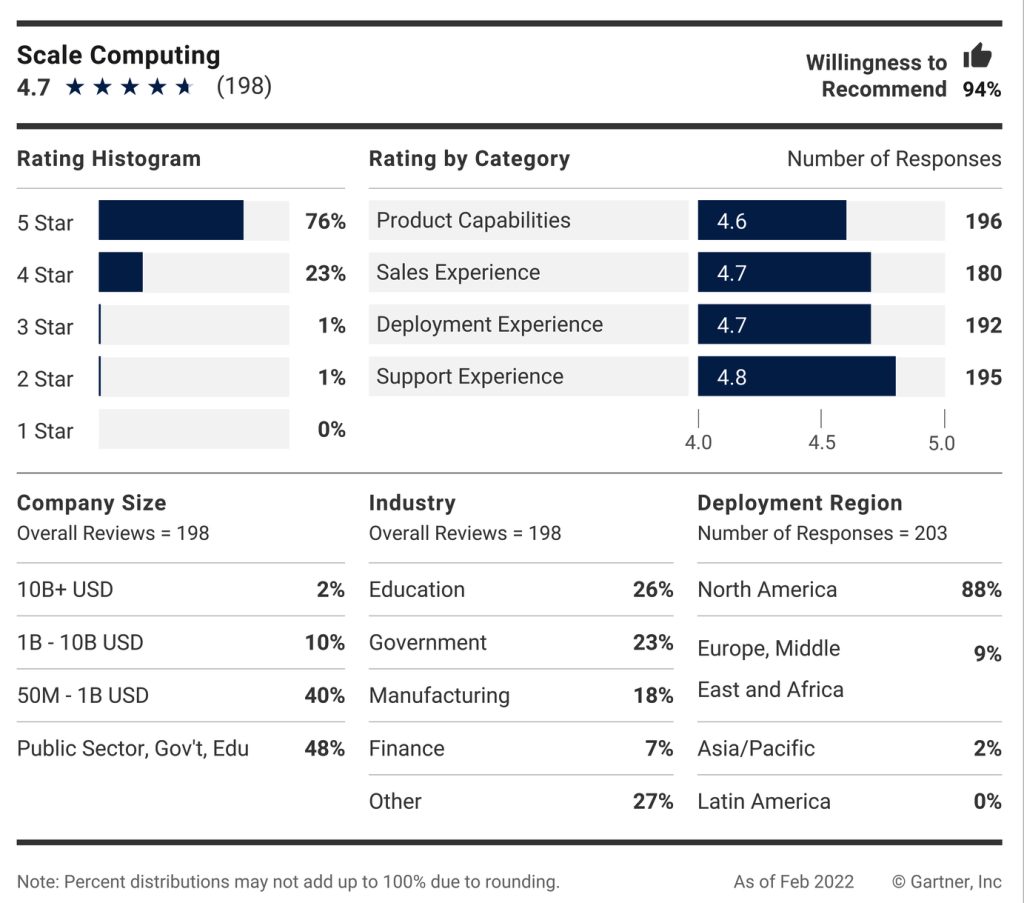
Figure 13. Peer Insights “Voice of the Customer” HCI Software SmartX Vendor Summary
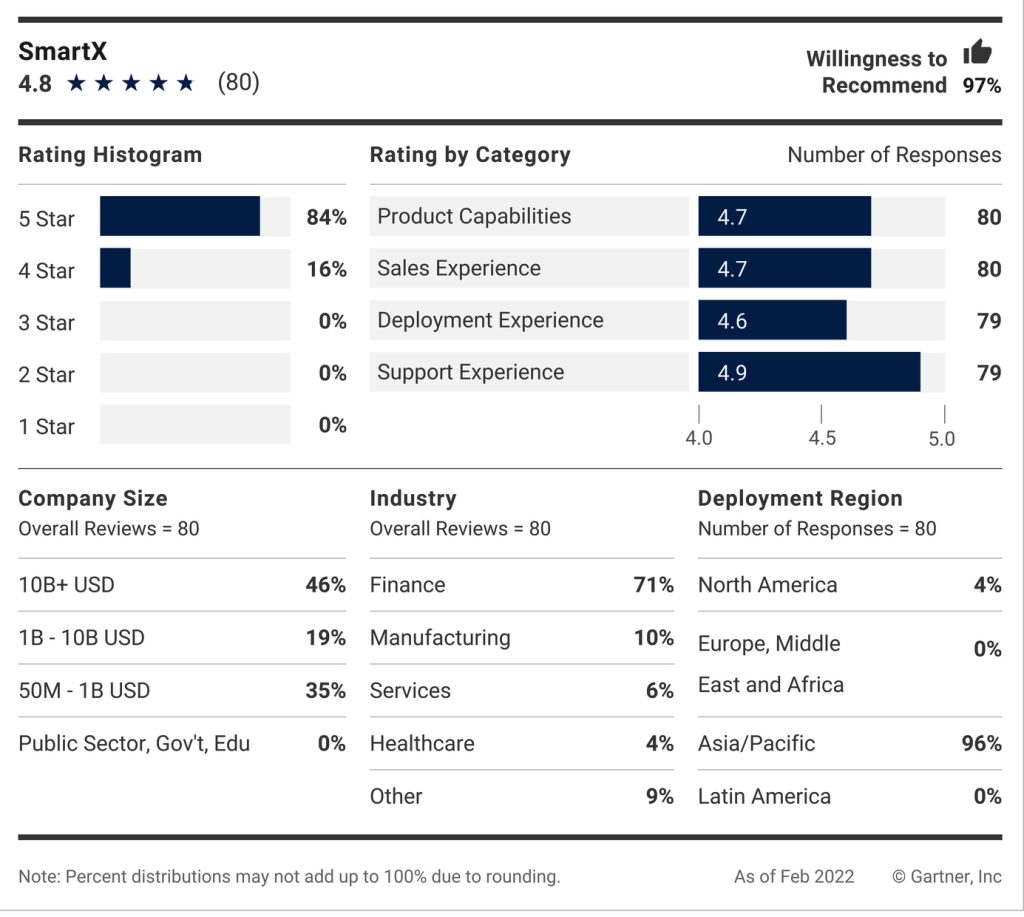
Figure 14. Peer Insights “Voice of the Customer” HCI Software StarWind Vendor Summary

Figure 15. Peer Insights “Voice of the Customer” HCI Software StorMagic Vendor Summary
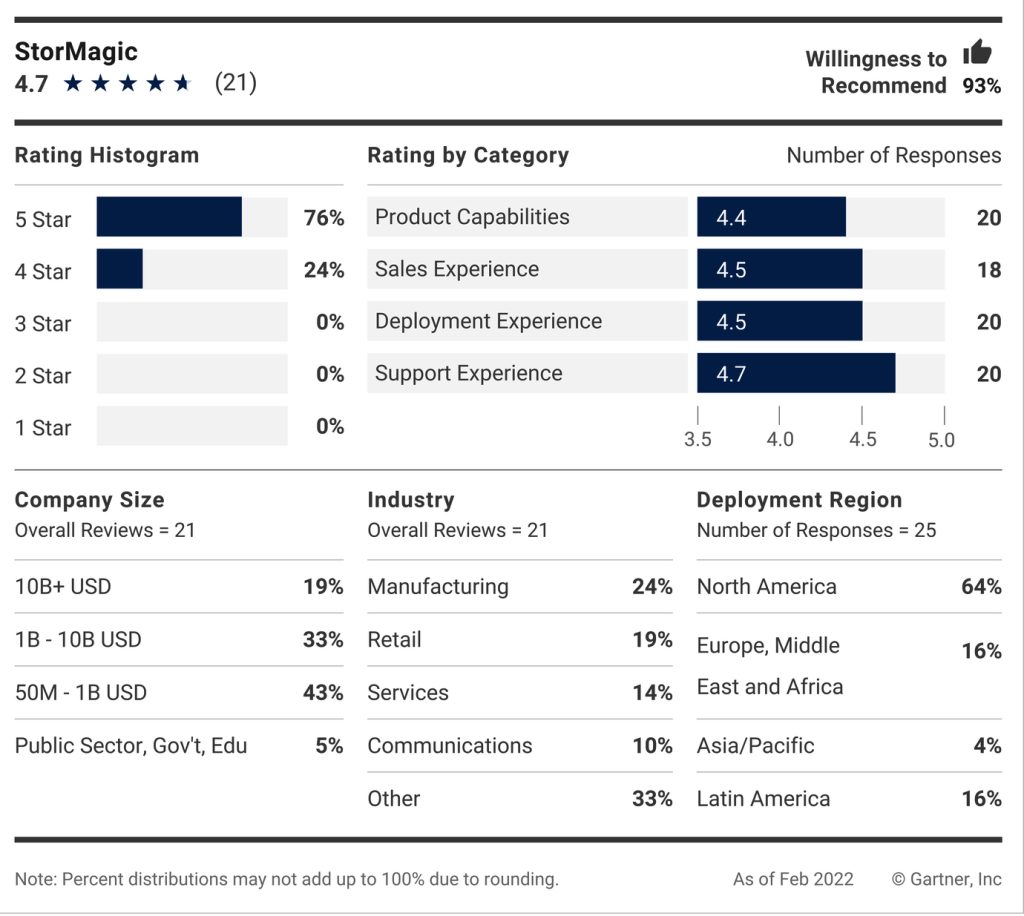
Figure 16. Peer Insights “Voice of the Customer” HCI Software VMware Vendor Summary


 Subscribe to our free daily newsletter


