


SSDs more Reliable than HDDs
At least when used as boot drives
This is a Press Release edited by StorageNewsletter.com on September 15, 2022 at 2:02 pm![]() This report, published on September 13, 2022, was written by Andy Klein, principal cloud storage evangelist, Backblaze, Inc.
This report, published on September 13, 2022, was written by Andy Klein, principal cloud storage evangelist, Backblaze, Inc.
The SSD Edition: 2022 Drive Stats Mid-year Review
This report builds on the 2021 SSD report published previously and is based on data from the SSDs we use as storage server boot drives in our Backblaze Cloud Storage platform. We will review the quarterly and lifetime failure rates for these drives and, later in this report, we will also compare the performance of these SSDs to HDDs we also use as boot drives. Along the way, we’ll offer observations and insights to the data presented and, as always, we look forward to your questions and comments.
Overview
Boot drives in our environment do much more than boot the storage servers: they also store log files and temporary files produced by the storage server. Each day a boot drive will read, write, and delete files depending on the activity of the storage server itself. In our early storage servers, we used HDDs exclusively for boot drives. We began using SSDs in this capacity in 4Q18. Since that time, all new storage servers, and any with failed HDD boot drives, have had SSDs installed.
Midyear SSD Results by Quarter
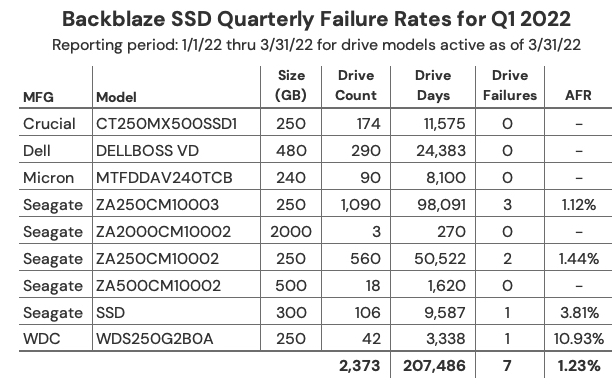
As of June 30, 2022, there were 2,558 SSDs in our storage servers. This compares to 2,200 SSDs we reported in our 2021 SSD report. We’ll start by presenting and discussing the quarterly data from each of the last two quarters (1Q22 and 2Q22).
Notes and Observations
- Form factors: All of the drives listed above are the standard 2.5″ form factor, except the Dell (DELLVOSS VD) and Micron (MTFDDAV240TCB) models each of which are the M.2 form factor.
- Most drives added: Since our last SSD report, ending in 4Q21, the Crucial (model: CT250MX500SSD1) lead the way with 192 new drives added: followed by 101 new DELL drives (model: DELLBOSS VD) and 42 WDC drives (model: WDS250G2B0A).
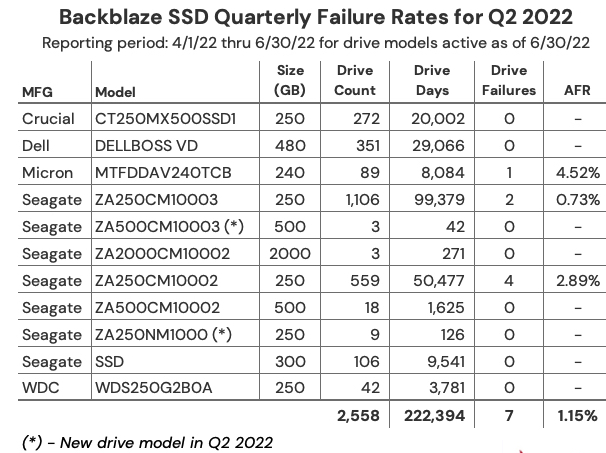
- New drive models: In 2Q22 we added 2 new SSD models, both from Seagate, the 500GB model: ZA500CM10003 (3 drives), and the 250GB model: ZA250NM1000 (18 drives). Neither has enough drives or drive days to reach any conclusions, although they each had zero failures, so nice start.
- Crucial is not critical: In our previous SSD report, a few readers took exception to the high failure rate we reported for the Crucial SSD (model: CT250MX500SSD1) although we observed that it was with a very limited amount of data. Now that our Crucial drives have settled in, we’ve had no failures in either 1Q or 2Q. Please call off the dogs.
One strike and you’re out: Three drives had only one failure in a given quarter, but the AFR they posted was noticeable: WDC model WDS250G2B0A – 10.93%, Micron – Model MTFDDAV240TCB – 4.52%, and the Seagate model: SSD – 3.81%. Of course if any of these models had 1 less failure their AFR would be zero, zip, bupkus, nada – you get it. - It’s all good man: For any given drive model in this cohort of SSDs, we like to see at least 100 drives and 10,000 drive-days in a given quarter as a minimum before we begin to consider the calculated AFR to be “reasonable”. That said: quarterly data can be volatile, so let’s next take a look at the data for each of these drives over their lifetime.
- SSD Lifetime Annualized Failure Rates
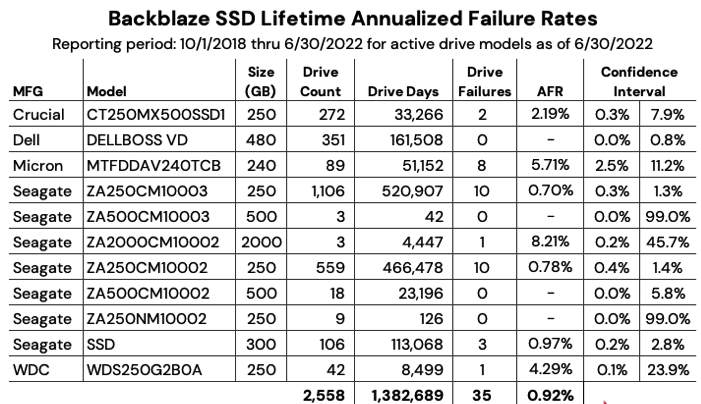
As of the end of 2Q22 there were 2,558 SSDs in our storage servers. The table below is based on the lifetime data for the drive models which were active as of the end of 2Q22
Notes and Observations
- Lifetime annualized failure rate (AFR): The lifetime data is cumulative over the period noted, in this case from 4Q18 through 2Q22. As SSDs age, lifetime failure rates can be used to see trends over time. We’ll see how this works in the next section when we compare SSD and HDD lifetime annualized failure rates over time.
- Falling failure rate: The lifetime AFR for all of the SSDs for 2Q22 was 0.92%. That was down from 1.04% at the end of 2021, but exactly the same as the 2Q21 AFR of 0.92%.
- Confidence Intervals: In general, the more data you have, and the more consistent that data is, the more confident you are in your predictions based on that data. For SSDs we like to see a confidence interval of 1.0% or less between the low and the high values before we are comfortable with the calculated AFR. This doesn’t mean that drive models with a confidence interval greater than 1.0% are wrong, it just means we’d like to get more data to be sure.
- Speaking of Confidence Intervals: You’ll notice from the table above that the 3 drives with the highest lifetime AFRs also have sizable confidence intervals.
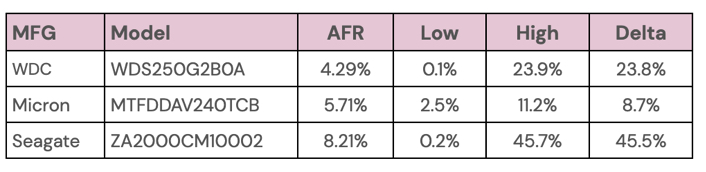
Conversely, there are 3 drives with a confidence interval of 1% or less, as shown below:
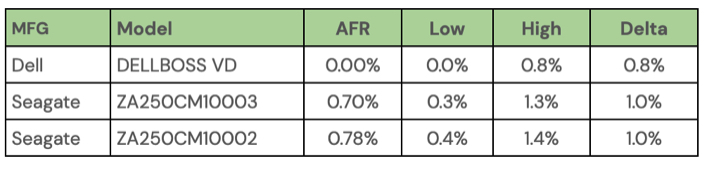
Of these three, the Dell drive seems the best. It is a server-class drive in an M.2 form factor, but it might be out of the price range for many of us as it currently sells from Dell for $468.65. The 2 remaining drives are decidedly consumer focused and have the traditional SSD form factor. The Seagate model ZA250CM10003 is no longer available new, only refurbished, and the Seagate model ZA250CM10002 is currently available on Amazon for $45.00.
SSD vs. HDD AFRs
Last year we compared SSD and HDD failure rates when we asked: Are SSDs really more reliable than HDDs? At that time the answer was maybe. We now have a year’s worth of data available to help answer that question, but first, a little background to catch everyone up.
The SSDs and HDDs we are reporting on are all boot drives. They perform the same functions: booting the storage servers, recording log files, acting as temporary storage for SMART stats, and so on. In other words they perform the same tasks. As noted earlier, we used HDDs until late 2018, then switched to SSDs. This creates a situation where the two cohorts are at different places in their respective life expectancy curves.
To fairly compare the SSDs and HDDs, we controlled for average age of the 2 cohorts, so that SSDs that were on average one year old, were compared to HDDs that were on average one year old, and so on. The chart below shows the results through 2Q21 as we controlled for the average age of the two cohorts.
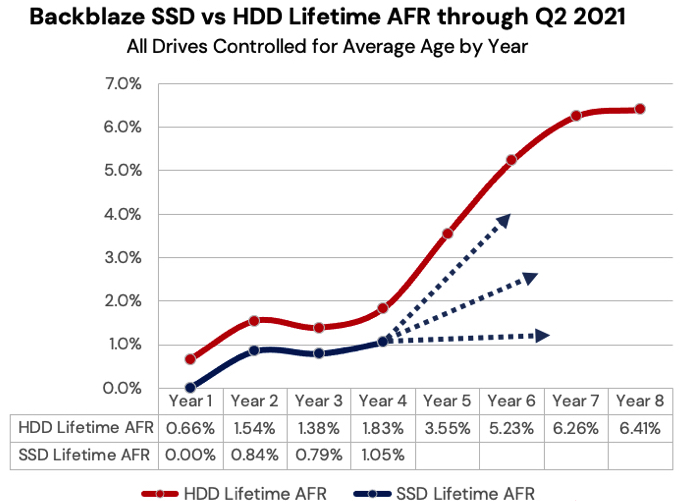
Through 2Q21 (year 4 in the chart for SSDs) the SSDs followed the failure rate of the HDDs over time, albeit with a slightly lower AFR. But, it was not clear whether the failure rate of the SSD cohort would continue to follow that of the HDDs, flatten out, or fall somewhere in between.
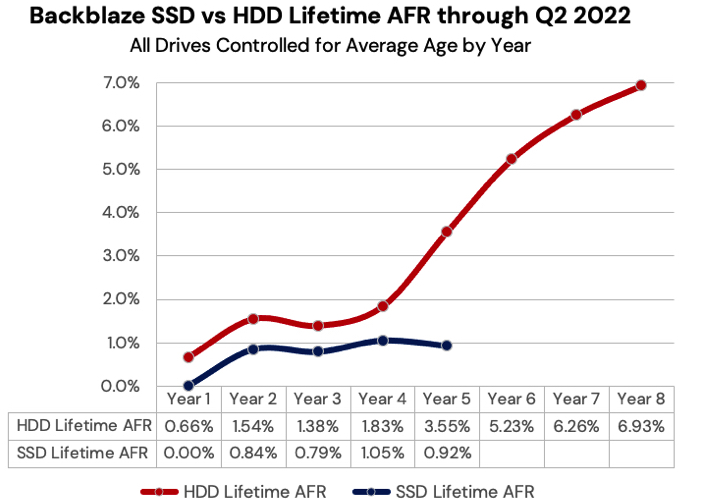
Now that we have another year of data, the answer appears to be obvious as seen in the chart below, which is based on data through 2Q22 data and gives us the SSD data for year 5.
And the Winner Is …
At this point we can reasonably claim that SSDs are more reliable than HDDs, at least when used as boot drives in our environment. This supports the anecdotal stories and educated guesses made by our readers over the past year or so. Well done.
We’ll continue to collect and present the SSD data on a regular basis to confirm these findings and see what’s next. It is highly certain that the failure rate of SSDs will eventually start to rise. It is also possible that at some point the SSDs could hit the wall, perhaps when they start to reach their media wearout limits. To that point, over the coming months we’ll take a look at the SMART stats for SSDs and see how they relate to drive failure. We also have some anecdotal information of our own that we’ll try to confirm on how far past the media wearout limits you can push an SSD. Stay tuned.
SSD Stats Data
The data collected and analyzed for this review is available on our HDD Test Data. You’ll find SSD and HDD data in the same files and you’ll have to use the model number to locate the drives you want, as there is no field to designate a drive as SSD or HDD.
You can also download the Backblaze Drive Stats data via SNIA IOTTA Trace Repository if desired. Same data; you’ll just need to comply with the license terms listed. Thanks to Geoff Kuenning and Manjari Senthilkumar for volunteering their time and brainpower to make this happen. Awesome work.
Comments
SSDs being more reliable that HDDs is not surprising.
On one side, you have HDDs based on mechanical designs (motors, rotating disks, moving heads.)
On the other side, SSDs are entirely based on silicon with no moving parts at all.
Next reports from Backblaze will confirm this trend. For sure.


 Subscribe to our free daily newsletter


