 HPE: Fiscal 3Q22 Financial Results
Storage down 2% Y/Y and up 5% Q/Q
This is a Press Release edited by StorageNewsletter.com on August 31, 2022 at 2:02 pm| (in $ million) | 3FQ21 | 3FQ22 | 9 mo. 2021 |
9 mo. 2022 |
| Revenue for storage only |
1,175 | 1,152 | 3,503 | 3,406 |
| Growth | -2% | -3% |
||
| Earnings before taxes | 177 | 169 | 602 | 745 |
Hewlett Packard Enterprise Development LP announced financial results for the third quarter, ended July 31, 2022.
Global revenue reached $7.0 billion, up 1%, in its 5 businesses: intelligent edge, HPC and AI, compute, financial services and storage.
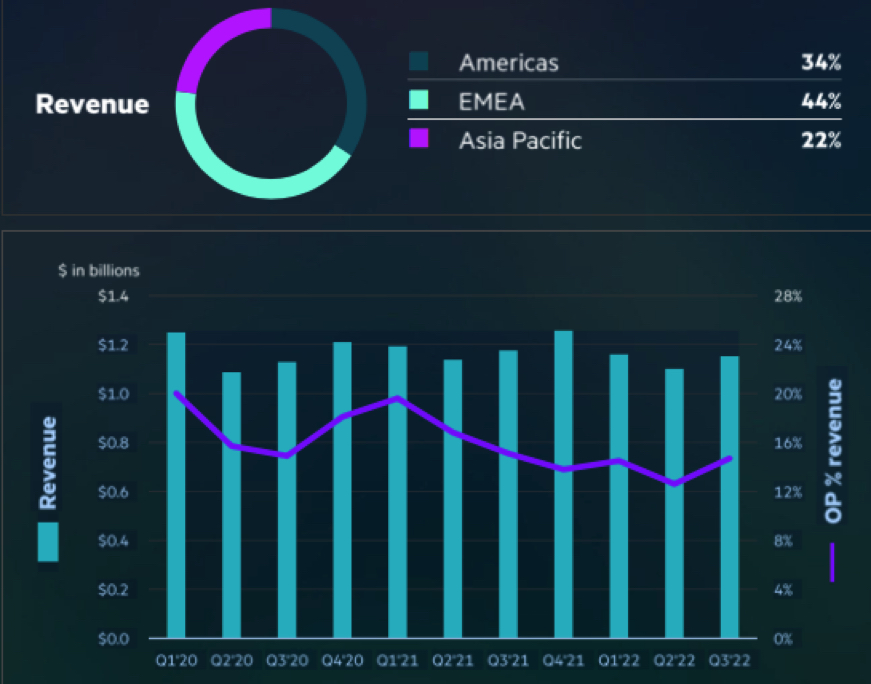
Storage revenue was $1.1 billion, down 3% from the prior-year period with 12.6% operating profit margin, compared to 16.8% from the prior-year period reflecting higher supply chain costs and unfavorable mix shift. It’s the lowest figure since 2FQ20.

Representing 16% of total sales, storage revenue was up 5% Q/Q at $1.152 billion for 3FQ22, and down 2% from 2FQ22 in actual dollars and up 1% when adjusted for currency, with 14.7% operating profit margin, compared to 15.1% from 2FQ22, and up 210 basis points sequentially, with favorable mix shift.
The company records double-digit revenue growth Y/Y in owned IP products, tracking the fastest ARR growth among segments.
Highlights:
. Backlog increased sequentially to anothe record level
. Double-digit growth Y/Y in Nimble and hyperconverged product revenue
. ARR growth of 44% Y/Y, subcription orders up 64% Q/Q
As-a-service offerings within storage like Block are also leading order and ARR growth among business segments. With the favorable mix shift, operating margins improved to 14.7%, up 210 basis points sequentially. With respect to Pointnext operational services, combined with storage services, orders grew again and are up year-to-date mid-single digits in constant currency, similar to levels for total FY21 despite the exit of our Russia business.
For FY22, there are few chances that the company will reach $4.8 billion in storage revenue like in FY21.
Revenue for HPE storage since FY17
(in $ million)
| Fiscal quarter |
Revenue |
Q/Q Growth |
Y/Y growth |
| FY17 | 3,280 | 3% |
|
| FY18 |
3,706 |
13% | |
| 1Q19 | 975 | 3% |
|
| 2Q19 | 942 | -3% |
|
| 3Q19 | 844 | -10% |
|
| 4Q19 | 848 | 0% |
|
| FY19 |
3,609 | -3% | |
| 1Q20* |
1,250 | -8% |
|
| 2Q20 | 1,086 | -18% |
|
| 3Q20 | 1,128 | -10% |
|
| 4FQ20 | 1,217 | 8% |
|
| FY20 | 4,681 | -10% | |
| 1FQ21 | 1,193 | -2% |
|
| 2FQ21 | 1,137 | -5% |
|
| 3FQ21 | 1,176 | 4% |
|
| 4FQ21 | 1,257 | 3% | |
| FY21 | 4,763 | 2% | |
| 1FQ22 | 1,156 | -8% | |
| 2FQ22 | 1,098 | -3% |
|
| 3FQ22 | 1,152 | 5% |
* HPE changes its accounting results in 1FQ20.


 Subscribe to our free daily newsletter

