


 Commvault: Fiscal 1Q23 Financial Results
$198 million revenue, up 8% Y/Y and down 4% Q/Q, much smaller net income
This is a Press Release edited by StorageNewsletter.com on July 27, 2022 at 2:02 pm| (in $ million) | 1Q22 | 1Q23 | Growth |
| Revenue |
183.4 | 198.0 | 8% |
| Net income (loss) | 13.9 | 3.5 |
Commvault Systems, Inc. announced its financial results for the first quarter ended June 30, 2022.
“We delivered another quarter of solid results, highlighted by double digit constant currency revenue growth,” said Sanjay Mirchandani, president and CEO. “We believe customers will continue to prioritize our best in class data protection and management solutions as they embrace the cloud and hybrid IT. We are confident in our strategy.”
Total revenues for 1FQ23 were $198.0 million, a yearly increase of 8%. On a Y/Y constant currency basis, total revenue growth would have been 13%.
Total recurring revenue was $170.8 million, a yearly increase of 20%. On a Y/Y constant currency basis, total recurring revenue growth would have been 25%. Recurring revenue represented a record 86% of total revenue.
Annualized recurring revenue (ARR), which is the annualized value of all active recurring revenue streams at the end of the reporting period, was $594.5 million as of June 30, 2022, up 12% from June 30, 2021. On a Y/Y constant currency basis, ARR growth would have been 16%.
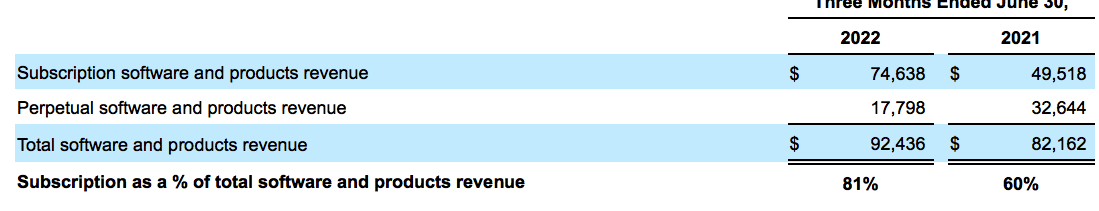
Software and products revenue was $92.4 million, an yearly increase of 13% Y/Y. The Y/Y increase in software and products revenue was driven by a 24% increase in larger deals (deals with greater than $0.1 million in software and products revenue). On a Y/Y constant currency basis, software and products revenue growth would have been 17%.
Larger deal revenue represented 75% of software and products revenue in 1FQ23. The number of larger deal revenue transactions was 184 deals for 1FQ23, compared to 185 deals for 1FQ22. The average dollar amount of larger deal revenue transactions was approximately $379,000, representing a 24% increase from 1FQ22.
Services revenue in the quarter was $105.5 million, an increase of 4% Y/Y. It continues to grow primarily due to the increase in Metallic software-as-a-service revenue.
On a GAAP basis, income from operations (EBIT) was $7.4 million for 1FQ23 compared to $15.5 million in 4FQ22. Non-GAAP EBIT was $40.6 million in 1FQ23 compared to $41.0 million in 1FQ22.
Operating cash flow totaled $22.4 million for 1FQ23 compared to $37.2 million in 4FQ22. Total cash was $258.7 million as of June 30, 2022 compared to $267.5 million as of March 31, 2022.
During 1FQ23, the company repurchased approximately 310,000 shares of its common stock totaling $18.9 million at an average price of approximately $61.10 per share.
Comments
Next quarter, the company was expected revenue of $195 million up 6% Y/Y and down 5% Q/Q. The final results are $198.0 million up 8% Y/Y and down 4% Q/Q, with much smaller net income at $3.5 million.
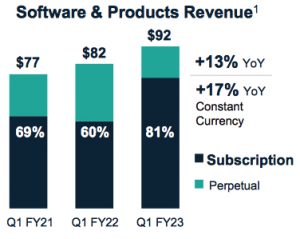 1 Does not include SaaS revenue
On a consolidated view, the revenue from software transactions over $100,000, increased 24% and represented 75% of software revenue.
Subscription software revenue increased 51% to $75 million. Subscription license sales represented 81% of total software revenue, which is an all-time high and compares to just 60% of total software revenue a year ago.
Subscription revenue
(in $million)
Americas region increased 15% driven by large deals as customers are spent on IT transformation projects with data management as a critical element. International region, which includes both EMEA and APJ, increased 8%, also driven by strength in larger enterprise transactions. On a constant currency basis, international software and products revenue hit 20% growth.
For 2FQ23, the company expectsoftware revenue to be in the range of $80 million to $84 million and total revenue to be in the range of $184 million to $188 million.
In recent fiscal years, 2FQ23 is a low point for software revenue. On a constant currency basis, the midpoint of software revenue guidance would be of 12% and total revenue would be up 8%. On the expense side, the firm expect 2FQ23 consolidated gross margins to be flat sequentially at approximately 83% which includes the impact from rapidly growing SaaS business. It believes that, at current revenue levels, it is nearing the low point for consolidated gross margins, and expects ongoing improvement as its SaaS business scales.
Revenue and net income (loss) in $ million
| Fiscal period | Revenue | Y/Y growth |
Net income (loss) |
| FY15 | 607.5 | 4% | 25.7 |
| FY16 | 595.1 | -2% | 0.1 |
| FY17 | 650.5 | 9% | 0.5 |
| FY18 | 699.4 | 8% | (61.9) |
| 1Q19 | 176.2 | 6% |
(8.6) |
| 2Q19 | 169.1 | 1% |
0.9 |
| 3Q19 | 184.3 | 2% |
13.4 |
| 4Q19 |
181.4 | -2% |
(2.2) |
| FY19 | 711.1 | 2% |
3.6 |
| 1Q20 | 162.2 | -8% | (6.8) |
| 2Q20 | 167.6 | -1% |
(7.1) |
| 3Q20 | 176.4 | -4% | (0.7) |
| 4Q20 | 164.7 | -9% | (5.6) |
| FY20 |
670.9 |
-6% |
(5.6) |
| 1Q21 | 173.0 | 7% | 2.3 |
| 2Q21 | 171.1 | 2% | (41.2) |
| 3FQ21 | 188.0 | 7% | 1.7 |
| 4FQ21 | 191.3 | 16% | 6.3 |
| FY21 | 723.5 | 8% | (31.0) |
| 1FQ22 |
183.4 | 6% | 13.9 |
| 2FQ22 |
177.8 | 4% | 1.7 |
| 3FQ22 | 202.4 | 8% | 10.0 |
| 4FQ22 | 205.9 | 8% | 8.0 |
| FY22 | 769.6 | 6% | 33.6 |
| 1FQ23 | 198.0 | 8% | 3.5 |
| 2FQ23 (estim.) | 184-188 | 3%-6% | NA |


 Subscribe to our free daily newsletter


