


 NetApp: Fiscal 1Q22 Financial Results
Nice period with sales up 12% and growing net income Y/Y
This is a Press Release edited by StorageNewsletter.com on August 27, 2021 at 2:03 pm| (in $ million) | 1Q21 | 1Q22 | Growth |
| Revenue |
1,303 | 1,458 | 12% |
| Net income (loss) | 77 | 202 |
NetApp, Inc. reported financial results for the first quarter of fiscal year 2022, which ended on July 30, 2021.
“Building on our accelerating momentum through last year, we are off to a great start to fiscal 2022, with strong revenue, gross margin, and operating leverage across the entire business,” said George Kurian, CEO. “Cloud and digital transformation initiatives remain top customer priorities and our results underscore the value we bring to customers in a hybrid, multi-cloud, data-driven world. With focused execution and demonstrated leadership, we are reshaping the industry. We made a number of innovation announcements this quarter, and we will continue to bring industry-leading capabilities to market, further enhancing our differentiated position in cloud and software.“
In 1FQ22, the company introduced 2 segments for financial reporting purposes: Hybrid Cloud and Public Cloud. A summary description of each segment follows.
• Hybrid Cloud offers a portfolio of storage and data management solutions that help customers build and integrate on-premises and private cloud environments. This portfolio is designed to operate with public clouds to unlock the potential of hybrid, multi-cloud operations. Hybrid Cloud is composed of software, hardware, and related support, as well as professional and other services.
• Public Cloud offers a portfolio of products delivered primarily as-a-service, including related support, and made available on the world’s leading clouds. This portfolio includes storage services, cloud automation and optimization services, and cloud infrastructure monitoring services.
Revenue and gross profit information has been disclosed for each segment, and prior period disclosures have also been revised for comparability. Stock-based compensation and amortization of intangible assets are not allocated to the segments.
1FQ22 financial results
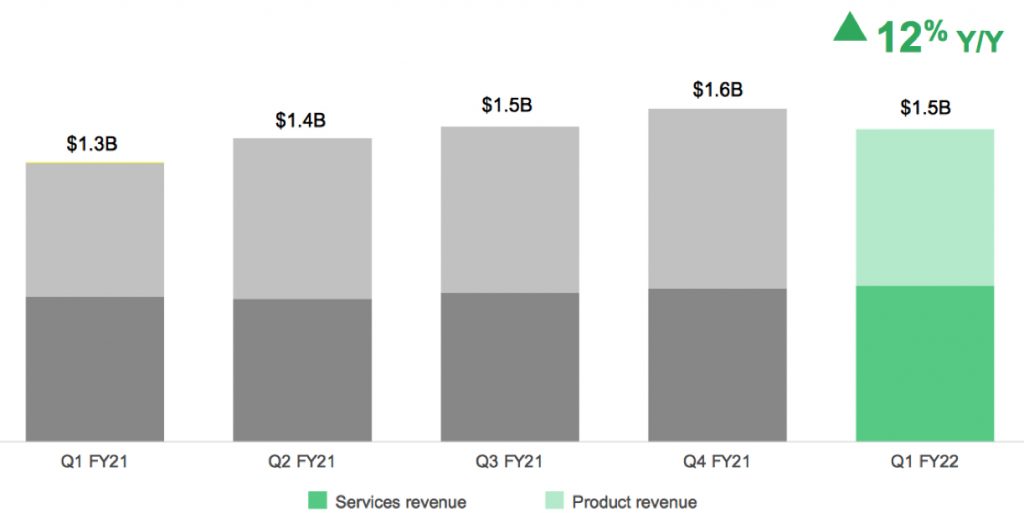
- Net revenues: $1.46 billion, compared to $1.30 billion in 1FQ21
- Hybrid Cloud revenue: $1.38 billion, compared to $1.27 billion in 1FQ21
- Public Cloud revenue: $79 million, compared to $31 million in 1FQ21
- Net income: GAAP net income of $202 million, compared to $77 million in 1FQ21; non-GAAP net income3 of $263 million, compared to $163 million in 1FQ21
- Earnings per share: GAAP net income per share4 of $0.88, compared to $0.35 in 1FQ21; non-GAAP net income per share of $1.15, compared to $0.73 in 1FQ21
- Cash, cash equivalents and investments: $4.55 billion at the end of 1FQ22
- Cash provided by operations: $242 million, compared to $240 million in 1FQ21
- Share repurchase and dividends: Returned $212 million to shareholders through share repurchases and cash dividends
Net revenue for 2FQ22 is expected to be in the range of $1.49 billion to $1.59 billion.
Net revenue for FY22 is expected to grow in the range of 8% to 9%.
Comments
NetApp was up 3% pre-market after these financial results beating top and bottom-line estimates.
It is its fifth consecutive quarter of increasing revenue with continuing net income since a much longer time.
Execution yielded 1FQ22 billings of $1.38 billion, up 20% Y/Y.
Revenue
Segment revenue and gross margin
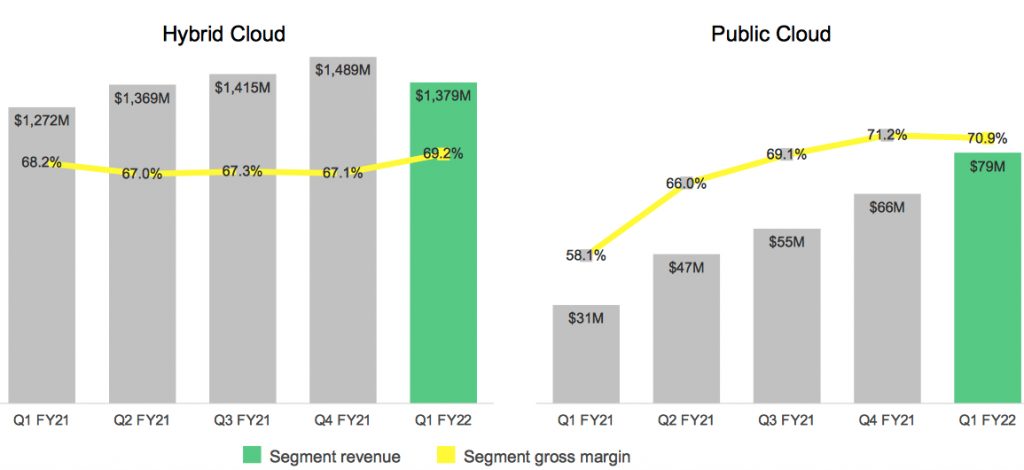
Total hybrid cloud revenue of $1.38 billion was up 8% Y/Y. Within this segment, the company delivered product revenue growth for the second consecutive quarter, and expect this trend to continue throughout FY22. Product revenue of $730 million increased 16% Y/Y. Throughout FY21, software products revenue of $414 million increased 33% Y/Y, driven by the continued mix shift towards AFA portfolio.
Public cloud ARR exited one at $337 million up 89% Y/Y and 12% Q/Q. Public cloud revenue recognized in the quarter was $79 million up 155% yearly. The growing scale of public cloud platform continues to positively impact the overall growth profile of the firm delivering 4 of the 12 points in revenue growth.
Totaled 1FQ22 recurring support revenue was $578 million flat Y/Y, excluding the 14th week from last year's compare, recurring support revenue was up 8% Y/Y.
When combined, software revenue, recurring support, and public cloud revenue totaled $1.1 billion and increased 17% Y/Y, representing 73% of total revenue, vs. 71% in 1FQ21. Recurring support and public cloud revenue of $657 million was up 8% Y/Y, constituting 45% of total revenue. Excluding last year's 14th week from the comparison, recurring support and public cloud revenue were up 16% Y/Y. The company ended the most recent quarter with over $3.9 billion in deferred revenue, an increase of 8% Y/Y.
1FQ22 marks the 14th consecutive quarter of yearly deferred revenue growth. The total gross margin of 69% was an all-time high. The total hybrid cloud gross margin was also 69% in the last. Within Hybrid Cloud segment, the product gross margin was 55% and benefited from the continued mix shift towards software-rich AFA systems.
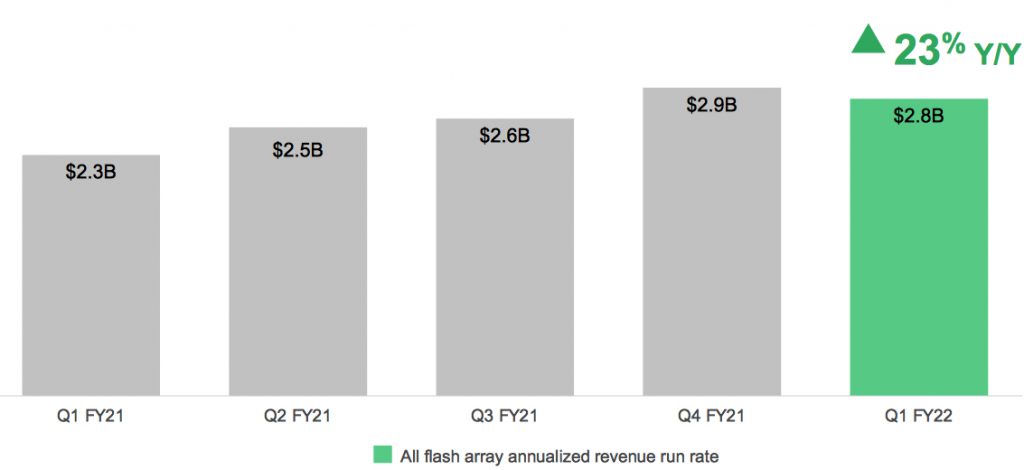
AFA annualized revenue run rate
Recurring support business continues to be very profitable with a gross margin of 92%. The public cloud gross margin of 71% was accretive to the overall corporate average. This is a milestone for the public cloud business as the firm continues to build out a diversified portfolio of cloud-based software offerings, and it expects this trend to continue as an increasing percentage of its public cloud business is built on software-only solutions.
CEO Kurian said: "Our strong customer momentum and the uniqueness of our public cloud services position furthers my confidence in our ability to reach our goal of $1 billion in public cloud ARR in FY25."
NetApp's financial results since FY2016
| Fiscal Period | Revenue | Y/Y Growth | Net income (loss) |
| FY16 | 5,546 | -9% | 229 |
| FY17 | 5,519 | -0% | 509 |
| 1Q18 | 1,325 | -11% | 136 |
| 2Q18 | 1,422 | 7% | 175 |
| 3Q18 | 1,523 | 7% | (506) |
| 4Q18 | 1,641 | 8% | 271 |
| FY18 | 5,911 | 7% | 75 |
| 1Q19 |
1,474 | 12% |
283 |
| 2Q19 |
1,517 | 7% |
241 |
| 3Q19 |
1,563 | 2% |
319 |
| 4Q19 |
1,592 | -3% |
296 |
| FY19 |
6,146 | 4% |
1,169 |
| 1Q20 |
1,236 | -16% | 103 |
| 2Q20 |
1,371 | -10% | 243 |
| 3Q20 |
1,404 | -10% | 277 |
| 4Q20 |
1,401 | -12% | 196 |
| FY20 |
5,412 | -12% |
819 |
| 1Q21 |
1,303 | 5% | 77 |
| 2Q21 |
1,416 | 3% | 137 |
| 3Q21 |
1,470 | 5% | 182 |
| 4Q21 |
1,555 | 11% | 344 |
| FY21 | 5,744 | 6% | 730 |
| 1Q22* |
1,370-1,470 | 5%-13% | NA |
| FY22* | 6,089-6,146 | 6%-7% | NA |
Revenue and net income (loss) in $ million
* Outlook


 Subscribe to our free daily newsletter


