Six Important Storage Premises Around NAND Flash and Tape Replacing HDD
HDD volumes to decline by 10x from 2021 to 2026
This is a Press Release edited by StorageNewsletter.com on February 17, 2021 at 2:21 pm![]() This report by David Floyer, Wikibon CTO and co-founder, and DiaNova foundation president and founder, was published on January 22, 2021.
This report by David Floyer, Wikibon CTO and co-founder, and DiaNova foundation president and founder, was published on January 22, 2021.
QLC Flash HAMRs HDD
Premise
This research examines 6 important storage premises around NAND flash and tape replacing HDDs .
The premises are:
1 Wikibon projects that flash consumer SSDs become cheaper than HDDs on a dollar per terabyte basis by 2026, in only about 5 years (from 2021).
2 It projects that HDD volumes will continue to decline rapidly by a factor of 10 by the end of this decade.
3 Innovative storage and processor architectures will accelerate the migration from HDD to NAND flash and tape by using consumer-grade flash.
4 As a result of 3, flash is lower cost over 5 and 10 years for almost all file-based workloads than HDD, when storage management and space are factored in.
5 Flash has already overtaken HDDs in total storage petabytes shipped. Wikibon projects the investments in flash fabs and hybrid flash/tape technologies will complete the takeover of HDD by the end of this decade.
6 The 10-year and 5-year business cases for QLC flash for implementation in 2021 and beyond for exascale NAS environments are compelling.
This research focuses on the exascale challenge, i.e., huge NAS file systems currently held in HDD farms. The innovative flash architecture chosen to illustrate an innovative storage architecture using consumer-grade flash is the VAST DASE (DisAggregated Shared Everything) architecture.
Executive Summary: Flash Becomes Cheaper than HDD by 2026
Wikibon applied Wright’s Law to determine that consumer flash drives will be cheaper than HDDs by 2026. As a result, it projects that the volume of HDD shipments will fall by a factor of 10 over the next 10 years. The HDD storage will be replaced by flash and tape with flash front-ends.
The positive and negative NAND flash technical characteristics will drive innovative storage architectures to address different application areas. This research addresses how flash is tackling one of the last holdouts of enterprise HDDs, big data NAS file systems, often referred to as the exadata challenge. Wikibon assesses new storage architectures that address exascale storage by using consumer-grade flash. VAST Data company, which specializes in this area, developed the architecture used in this analysis.
Consumer volume demand for storage in PCs drove HDD shipments’ original growth from the 1980s to 2010. The same HDD technology was then adapted for datacenter and cloud storage. Today, consumer volume demand for flash in mobile devices is now driving HDDs’ replacement for consumer products. It will drive replacing most datacenter and cloud HDD farms with consumer flash-based alternative architectures.
Innovative Architectures and Consumer Flash Outperform HDD on Price
Figure 1 below shows an IT department 10-year business case for deploying an all-QLC consumer flash solution compared with HDD. The left-hand y-axis is the 10-year Net Present Value (NPV) for 10PB of initial storage growing at 30% per year.
Figure 1: Executive Summary 10-Year Costs and Benefits of HDD Vs. SSD with an In-Line Data-Reduction Factor of 2.0 for QLC Flash
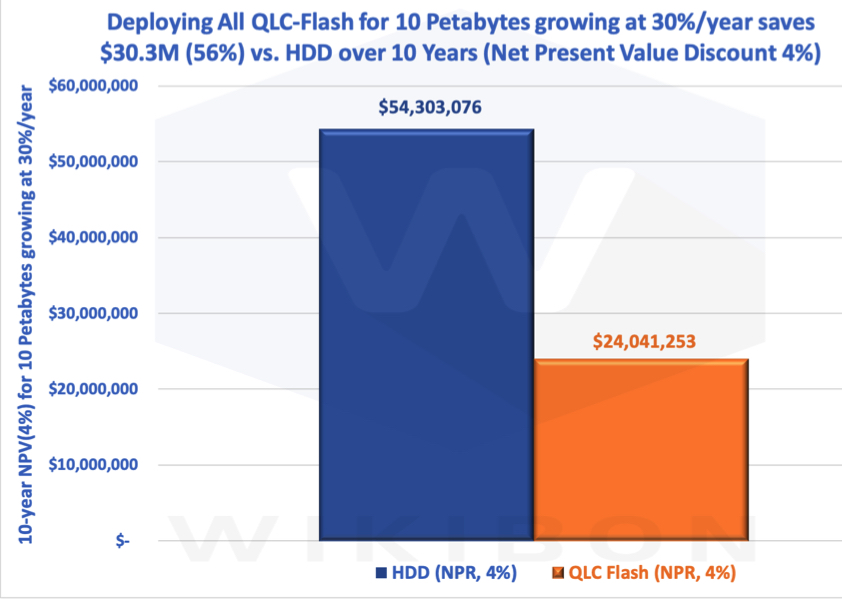
The left-hand blue column is the 10-year costs and benefits to the IT budget for HDD, with an NPV of $54.3 million. The NPV interest rate is assumed to be 4%. The right-hand orange column shows the IT budget costs and benefits of using QLC consumer flash, $24.0 million. The IT budget 10-year saving is $30.3 million NPV.
The business case in Figure 1 assumes an in-line data-reduction factor of 2.0 for QLC flash because flash solutions allow for better use of data-reduction algorithms for most file-based applications.
The 10-year time-scale is chosen as the primary business case because most storage systems stay in place well over the initial 4 or 5-year business case because of the high-cost cost of installing a new system in parallel, moving the data, and changing the operational procedures. Most storage systems stay in place for well over 10 years.
The Business Cases HDD vs. Consumer QLC Flash Business Cases HDD Vs. Consumer QLC flash section below gives the details of 10-year and 5-year business cases with an in-line data-reduction factor of 1.0 and 2.0. for QLC flash. The financial analysis of all the business cases has a positive NPV, break-even, and IRR (Internal Rate of Return). The business case’s financial analysis in Figure 1 above shows an NPV saving of $27.6 million, a break-even of 10 months, and an IRR of 149%. This business case would likely past muster with the CFO.
The main factors which affect the business case are:
• Storage equipment less depreciation
• IT budget for CPU/GPU (10% saving from consumer QLC flash)
• Application, database, and operational software IT budget (10% saving from QLC)
• Equipment installation
• Maintenance (maintenance is lower for HDD)
• Power and space rental ($3,000/month/rack)
• Storage administration and operations staff
All the 10-year case factors with an in-line data-reduction factor of 2.0 are better for consumer QLC flash than HDD, except maintenance.
Wright’s Law and HDD Storage Volume
Theodore P. Wright was an aeronautical engineer. He formulated Wright’s Law in 1936. It links efficiency to experience, or more simply as “We learn by doing.” He proposed that each percentage increase in cumulative production results in a fixed percentage improvement in production efficiency. This is often stated as “for every cumulative doubling of units produced, costs will fall by a constant percentage.” When applied to storage technology, volume drives cost reductions, allowing price reductions, improving demand, and increasing volume. Wrights law is often presented as learning curves.
Figure 2 below shows the millions of HDDs shipped from the beginning to the present (2020). The y-axis is the number of HDDs shipped annually, in millions. The top half of the columns are the consumer drives, and the lighter blue section at the lower end of the columns shows the datacenter HDDs. Figure 2 shows very clearly that consumer volumes were the major part of the magnificent journey.
Figure 2 – HDD Shipments 1976 – 2020
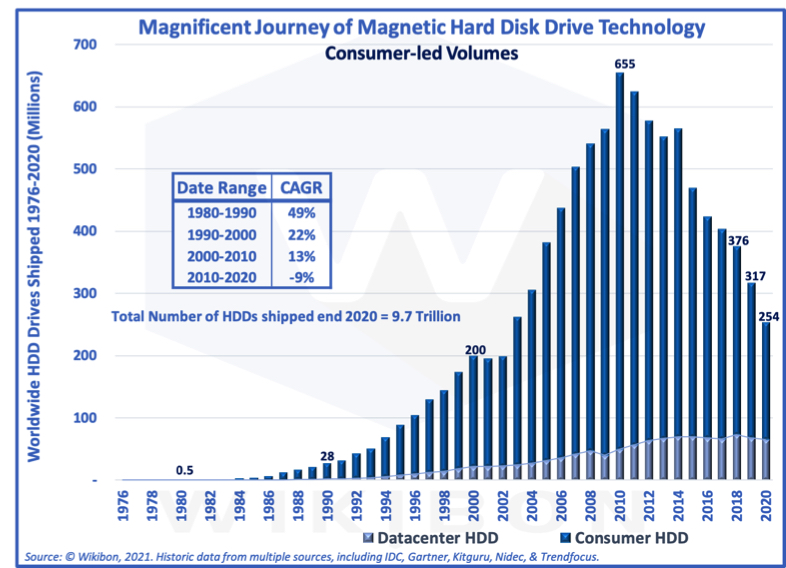
The volume of consumer HDDs shipped was rapid in the early days. This volume drove down the HDD cost (Wright’s Law), which drove increased HDD volumes to be purchased. The rapid increase in sales allowed for aggressive R&D to implement new HDD storage technologies with improved storage density. Initially, these new technologies were more expensive than the previous ones. However, the high volumes drove production costs down quickly (Wright’s Law), and costs continued to decline.
Consumer PCs were the primary factor in growing HDD storage volume. Enterprise HDD products from the same HDDs came 2 to 3 years later, building on the consumer PC volume. Enterprise HDD storage knocked out most tape drives in enterprise datacenters.
Introduction of Flash
In 2006, Steve Jobs bet on flash for the iPod Nano. Two years later, the Apple iPhone changed consumers’ buying preferences by introducing smartphones and other mobile devices. EMC introduced the first enterprise SSDs in 2008.
In 2010, PCs and the HDDs in the PCs reached their shipment peaks. Flash started to make inroads into consumer spending as volumes of smartphones, tablets, and flash-only PCs grew. As Figure 2 above shows, HDD shipments after 2010 have declined at -9% per year.
Flash has many advantages. It is smaller, much faster, easier to program, easier to maintain, has no moving parts, can be safely dropped, has lower maintenance costs, lasts 10 years or longer, and has lower energy costs.
Flash is fun, but HDDs are cheap. If only, flash were as cheap as HDDs!
Wright’s Law: Flash and HDD Prices Converge
Historic Storage Pricing
The first 2 rows of Table 1 below shows in detail the historical pricing of HDDs and SSDs. The third row shows the ratio between SSD $/TB and HDD $/TB. The ratio has dropped dramatically. Wrights law would predict that the rate of price decline would go down over time. This can be clearly shown in the HDD price decreases in row 4 of Table 1. The HDD year-on-year percentage decline is -12% for 2014 over 2013 and 7.2% for 2020 over 2019.
The SSD figures are affected by the flash shortages in 2017 and 2018 (see Figure 3 below). However, Wright’s Law would predict the same general year-on-year price decline for flash pricing.
Table 1 – SSD/HDD Ratio $/TB 2013-2020

Source: Wikibon, 2021. Wikibon uses historical data is from multiple sources, including IDC, Gartner, Kitguru, Nidec, & Trendfocus.
Figure 2 above shows the volume of disk drives reducing by 9%/year from 2010 to 2020. The volume of flash exabytes shipped has grown by 35% over the same period.
Log-Graph Show Rapid Convergence of SSD and & HDD $/TB
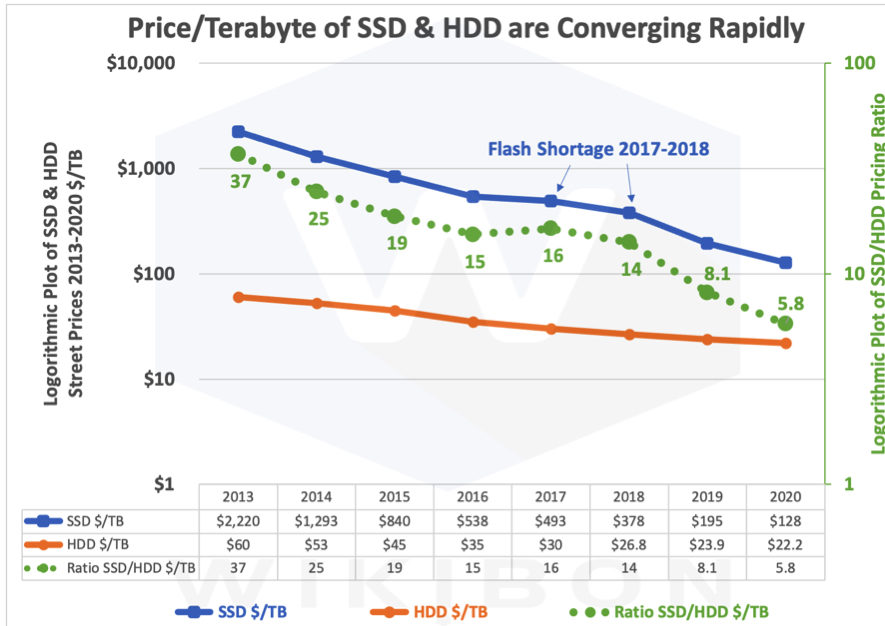
Figure 3 shows flash & HDD storage’s historical costs in dollar per terabyte).
Figure 3 – Flash and HDD Pricing 2013-2020
Source: Wikibon uses historical data is from multiple sources, including IDC, Gartner, Kitguru, Nidec, Trendfocus, and Wells Fargo LLC
The left-hand y-axis is the log-plot of SSD pricing (blue line) and HDD pricing (orange line) from 2013 to 2020. The data is in the table at the bottom of Figure 3. The orange line is relatively straight, showing a steady decline in HDD pricing. The blue line goes up in 2017 and 2018 and down again in 2019 due to NAND flash shortages.
The green right-hand y-axis is the log-plot of the ratio between SSD and HDD prices. The ratio was 36.9 in 2013 and is 5.8. in 2020. In December 2020, the NewEgg prices of Seagate IronWolf NAS 14TB and 16TB NAS HDDs were an average of $450. 15TB SSDs were on average $2,500. The SSD/HDD price ratio per terabyteB is about 5.5.
Wikibon expects this ratio to continue to decline. When the ratio is one, the pricing of SSD and HDD will be the same. As the only benefit for HDD is dollar/TB, it will be game over for HDD. When could that be? The next sub-section below shows the Wikibon projection using Wright’s Law.
Projected HDD and Flash Storage Pricing
The first 3 rows of Table 2 below shows the Wikibon Projections of HDD in $/TB and SSD in $/TB. These price decreases are driven by the HDD and SSD year-on-year percentages below. As shown in rows 4 and 5 of Table 2, the percentage reductions go down over the years, driven by Wright’s Law. Wikibon believes this is a more accurate forecasting method than using CAGRs.
Table 2 – Wikibon Projections SSD/HDD Ratio $/TB 2020 – 2030
Wright’s law would predict that there will be more cost reduction in flash storage costs than HDD storage costs. This forecast is born out by the actual price reductions and is reflected in the future price reductions. Volume leads to production efficiency and lower costs.
Figure 4 below brings all the historical and projected figures together.
Figure 4 – SSD/HDD Pricing Ratio 2013-2030
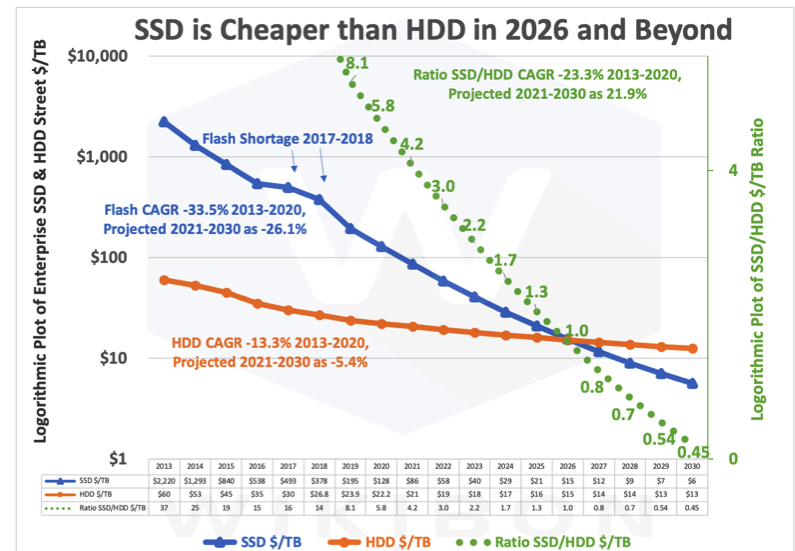
The y-axis in Figure 4 is the log-plot of the SSD/HDD $/TB ratio shown as a green line. It takes the same green line shown in Figure 2 and extends it to the end of the decade.
The green line in Figure 4 projects flash reaches the 1 line during 2026. Flash has an overwhelming advantage over disk if the price is equal.
Wikibon bases this projection on the historical learning curves of flash and HDD technologies. Is this projection reasonable going forward? Are there volume factors in future flash or disk drives that might change this projection? Would the overwhelming benefits of flash mean that the most workloads would move to flash become an overwhelming benefit earlier than 2026? Are there any other technologies that might move in?
To check, we need to look deeper into technology projections for flash and HDD and see if any changes should be made to Figure 4.
Figure 5 – Micron 176 layer QLC flash with reduced footprint, lower power, and improved latency

3D NAND allows NAND capacity to increase in 3 dimensions. The first is vendors expanding the number of layers of storage cells stacked on top of each other. The second is the number of bits that each cell can hold. The third is the reduction of the size of the die and the thickness of the layers.
In November 2020, Micron announced a 176-layer flash product with 4 bits per cell (QLC). It uses RG (Replacement Gate) technology, which reduces the capacitance, reduces the amount of power required, and improves read and write latency by over 25%. Also, it has reduced the tower’s width and depth in Figure 5 by 33% compared with the previous Micron technology.
Micron also announced the availability of this technology in its Crucial consumer QLC SSDs.
This impressive announcement shows that the flash market is vast, stretching from cloud data centers to IoT devices to autonomous systems to consumer devices of all types.
The NAND flash market is very competitive. Intel, Kioxia (previously Toshiba), Micron, Samsung, and SK Hynix (which has agreed to purchase Intel flash business) are the major flash technology players. All are investing heavily in research and production capability. These companies believe that 500 layers or more are possible, and PLC will add 1 bit to each cell. Micron announced that it sees the ability to improve price-performance by at least 30% each year for the next 5 years. Wikibon’s assumptions in Table 2 are a little more conservative, showing less than 30% in 2024 and beyond.
In addition to the major manufacturers, China has invested in flash technology fabs expected to come online in 2021. Wikibon believes enterprises will see healthy competition in flash technology over the next decade.
When do line Lines Cross?
Flash technology volumes are growing fast, both in SSDs and other form factors. Flash is deployed in data centers, preferred by consumers, and distributed in IoT and almost every other device type. Wikibon believes that the cost reduction assumptions for flash underlying Table 2 and Figure 4 are sound. However, we need to address possible future HDD investments. Will Seagate’s HAMR investment be disruptive? The next section analyzes HDD technologies.
Seagate HAMR HDD Technology History
Figure 5: ASTC 2014 HDD Technology Roadmap
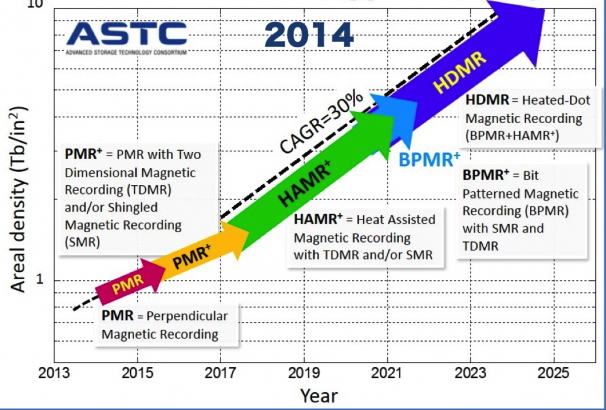
Source: IDEMA 2014 ASTC Technology Roadmap downloaded 5/20/2019. Wikibon modified the chart in 2021 to include the 2014 date.
ASTC (Advanced Storage Technology Consortium) published an HDD roadmap in 2014, shown in Figure 5 below. The left-hand axis is a log graph of the areal storage density in terabits per square inch. An areal density of 1 would enable a 10TB disk drive, and 10Tb/in2 would allow 100TB disk drives.
The technology in 2014 was PMR (Perpendicular Magnetic Recording), and it remains the primary HDD technology today.
The roadmap in Figure 5 predicted a different story. It shows the introduction of HAMR (Heat Assisted Magnetic Recording) in 2017 and the ability to introduced these technologies in the 2022 time frame. ASTC projected that HAMR and subsequent technologies would allow for an annual 30% improvement in drive density, translating to a 30% yearly improvement in cost and price/performance.
HAMR HDD Today – Announcements about Announcements
Today, HAMR technology has been introduced as a beta product to some cloud providers. Seagate has announced a delay in the announcement of HAMR every year for the past 5 years. Late in 2020, the company said that they would announce 20TB HAMR drives soon with an important caveat that it will not be available in volume.
Seagate is a great technology company with every motivation to make HAMR work. 100TB drives would be a tremendous improvement for enterprise and cloud users, especially at $500/drive. So why didn’t Seagate introduce HAMR? The case study in the next section shows the challenge facing Seagate executives.
Case Study – The Cruelty of Wright’s Law
Wright’s Law is Kind in Growing Markets
Figure 6 below shows how kind and cruel Wright’s Law is. It is a model of two scenarios, the green line and the red line. The left-hand y-axis is profitable HDD’s produced, i.e., the number produced per year starting at the beginning of 2018. It is calculated from the number of new drives (e.g., HAMR or MAMR) produced, less the number of new drives required to bring the cost below the current PMR HDDs, and less the number of drives required to break-even. The number of drives expected to be sold in 2018 is 376 million. The number of drives required to bring down the cost below PMR costs is assumed to be 865 million. After the first 865 million drives have lost money, it is assumed that an additional 865 million drives will be required to break-even.
Figure 6 – Kindness & Cruelty of Wright’s Law – a Case Study showing the Financial Consequences of Wright’s Law in Growing and Declining Markets
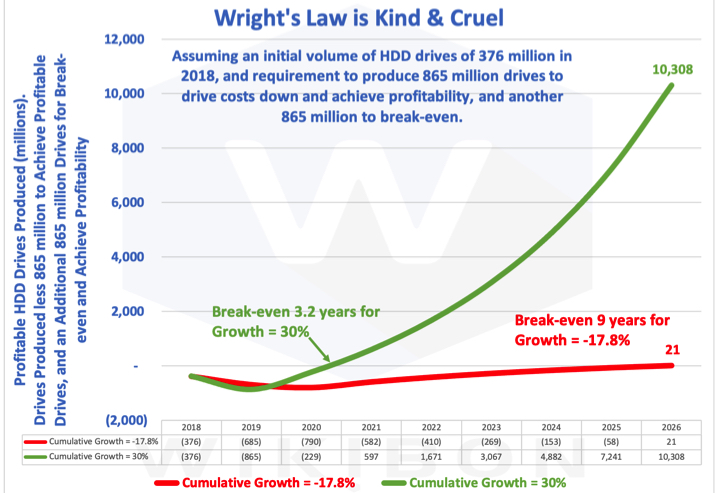
The green line in Figure 6 assumes a growth rate is 30%. This rate was common in the early days of HDD. The rate from 1980-1990 was 49% (see Figure 2). The growth rate of flash technologies is over 30% at the moment. Figure 6 shows that 865 million HDDs are produced by the end of the second year. The break-even is achieved after the second 865 million drives in just over 3 years. The model projects the number of fully profitable drives sold as 10 billion by 2026.
A CFO reviewing this business case, which expects 10 billion profitable drives by 2026, and break-even in about 3 years, will likely give the go-ahead. Introducing new technology in this environment is financially much easier, and Wright’s Law is kind. One happy CFO.
Wright’s Law is Cruel in Declining Markets
The red line in Figure 6 above represents a business decision facing HDD vendors at the start of 2018. This scenario assumes the same expected shipments for HDD drives of 376 million in 2018. The market decline is -17.8% per year. These are the historical HDD numbers from 2018-2020 from Figure 2 above.
Introducing a new technology (e.g., HAMR or MAMR) almost always means that the initial costs are higher than the current technology (PMR) costs. SDK (Showa Denko K.K.) produces the platters for HAMR drives, costing far more than existing PMR platters. The same is true for the new R/W heads. The red line model assumes the same cumulative production of 865 million drives is required to drive down the production learning curve to below the PMR drives’ cost (Wright’s Law), and the same additional 865 drives to reach break-even.
The red line reaches a break-even in 9 years with the opportunity to sell 21 million drives. Put yourself in the shoes of an HDD vendor CFO in 2018. This person is being asked to fund 9 years of investment for the chance to sell 21 million drives at a profit. The sad conclusion for an HDD CFO is that introducing HAMR or MAMR in volume to replace PMR is extremely high risk and could bankrupt the company. The alternative decision to stay with the current PMR technology and improve it where possible is a financial no-brainer.
The model in Figure 6 also shows that in a declining market, the business case for investing in new technology gets worse every year you wait. If the business case was not there in 2018, it has become far worse in 2021. Because of this analysis, Wikibon believes HDD vendors of HAMR and MAMR are unlikely to drive down the costs below those of the current PMR HDD technology and are unlikely to cut-over to volume production HAMR or MAMR drives.
There are serious limitations in the model behind Figure 6. It is over-simplified, the specific figures used are not accurate, and many other factors are not considered. However, it does show the fundamental problem of bringing innovation into a declining market. Wright’s Law is cruel in declining markets. There are plenty of ways of making good returns in a declining market. Figure 6 shows that investing in aggressive innovation is essential in a rapidly expanding market. Conversely, incremental improvement of existing technologies is probably the best strategy in a declining market.
Figure 6 is Wright’s law writ large.
Why Are HDD Vendors Continuing to Invest in HAMR/MAMR?
Figure 6 above shows the challenge facing HDD vendor investments in HAMR and MAMR. The executives of all technology companies have a deep understanding of Wright’s Law and learning curves. Why haven’t Seagate abandoned HAMR and Western Digital and Toshiba abandoned MAMR?
One reason is that HDD executives might believe the data explosion could result in much more data creation that needs storing forever. Forbes published several forecasts in 2018 and 2019 that indicated a doubling of nearline HDD sales growth to cloud providers by 2024. Some analysts were predicting a slowdown in decline and potential growth in the HDD market after 2018. If the HDD market grew again, HDD executives might justify making investments to introduce HAMR and MAMR technology.
Having invested in HAMR and MAMR over the years, a second reason HDD executives are publicly loath to abandon investment is they might believe flash will meet technical roadblocks.
Many HDD executives seem to believe that investors could never afford to make enough flash fabrication plants. A myth is still repeated today despite flash overtaking HDD in EBs manufactured (see “An Exabyte View of HDD, Flash and Tape” section below.)
HDD executives might have to continue to spend money on HAMR and MAMR because HDD vendors could lose sales if there were no long-term future for HDD.
In Wikibon’s opinion, investments in HAMR and MAMR are not the HDD vendors’ main focus. Executives are placing significant emphasis on production efficiency, lower sales and distribution costs, and are extracting good profits in a declining market. Wikibon would expect further consolidation of vendors and production facilities as part of this focus on cost reduction.
Future of HDD
Wikibon concludes that:
• Consumer QLC flash volumes will grow rapidly and become the same cost as HDD in about 2026.
• The HDD market will not grow again, and that future HDD technologies such as HAMR and MAMR are unlikely to come to market.
• The difference in user value between the current 18TB drives using PMR and 20TB HAMR drives is nowhere near the cost difference, and the future volumes of HDD drives are unlikely to support the introduction of HAMR or MAMR.
• 20TB PMR drives will probably arrive soon, and some small increases beyond that.
• For workloads that are primarily sequential writes, the Shingled Magnetic Recording (SMR) is a technology that can increase the density of HDDs.
• For big data NAS file systems, the subject of this research, PMR drives, are the appropriate technology.
Figure 7 represents Wikibon HDD projections based on the above conclusions. The blue columns in Figure 7 are the same as in Figure 1 and show the historical HDD shipments in millions. The orange columns show projection of HDD shipments in millions. The forecast shows an accelerating decline as the cost of flash gets closer to HDDs. The table in Figure 7 shows HDD volume CAGR was -9% from 2010 to 2020. Wikibon projects that the decline from 2020 to 2025 will be about 14% per year.
After 2025, Wikibon projects the HDD shipments will decline by -27% per year. The main reason is that flash will be the dominant technology for almost all large-scale storage. HDD production will primarily be for the replacement and extension of existing HDD installations.
Figure 7 – History and Wikibon Projection of HDD Shipments (millions)
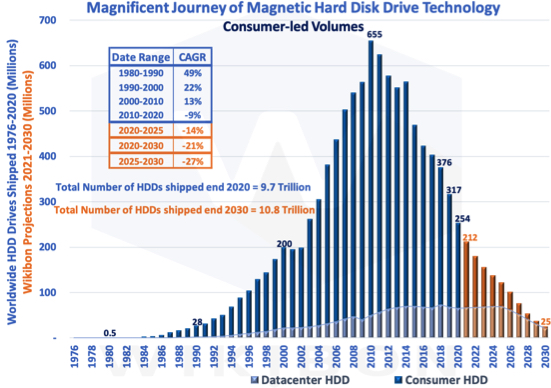
Figure 8 shows that the consumer sector will decline first, as the benefits of lower power, smaller footprint, and greater reliability are more important to consumers. The y-axis in Figure 8 shows HDD shipments from 2010 to 2030 in millions. It shows consumer HDD shipments in green and datacenter shipments in blue. Datacenter HDDs have increased by 2.7% per year from 2010 to 2020. The consumer shows a sharp decline of 11.0% in the same period.
Figure 8 – HDD Shipments (millions) Split by Consumer and Datacenter
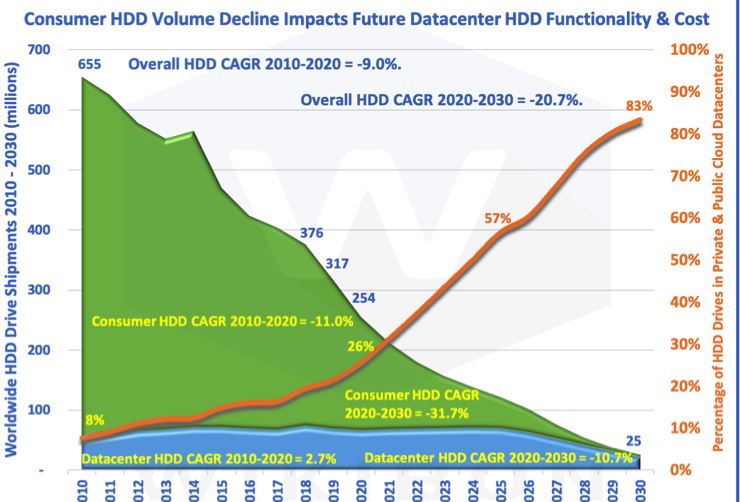
Wikibon projects an even sharper decline of consumer HDDs from 2020 to 2030 of 31.7%/year. The projected decline of datacenter HDDs is about 10.7%/year over the same period. The orange line shows the percentage of shipments for both cloud and enterprise datacenters. The rate was 8% in 2010, 26% in 2020, and Wikibon projects 84% by the end of the decade. Consumer volume is usually essential for the successful introduction and growth of any technology.
Wikibon believes that the HDD industry will continue to develop PMR technology and should get to between 24-26TB/HDD drive in the next 5 years. HDD vendors will focus on products for the datacenter (3.5″ drives) because the consumer market has collapsed. Simultaneously, the expected industry consolidation will also help reduce costs, as fear of monopoly gives way to pragmatism for the HDD ecosystem.
Exabyte View of HDD, Flash and Tape
One consistent myth is that the world cannot build enough NAND flash fabs to meet the storage demand growing at 25% per year. Presenters who should know better try to show that enterprise SSDs exabytes are only 10% of the HDD exabytes shipped to support that myth.
An exabyte is a million terabytes. Figure 9 shows the Wikibon projection of exabytes from 2019-2030. The dark blue area in Figure 9 is the SSD exabytes shipped every year. The light blue area is the other flash form-factors (e.g., thumb drives, camera cards, etc.) and is a larger market by capacity than flash SSDs.
The magnetic media are tape in yellow and HDD in orange at the bottom. The HDD exabytes shipments grow until 2025 and then declines rapidly as the flash/HDD pricing ratio declines to parity.
Wikibon projects that tape media is improving in density by about 30%/year and has a much lower cost basis. It expects tape libraries with flash front-ends to expand to take over the massive amounts of write-once/read-rarely data, particularly in sequential data types such as video and surveillance.
Tape cartridges have the additional benefit of having a physical air-gap, which will be essential to combat the sophisticated US government data penetrations of 2020 due to hijacking system software updates.
Figure 9 – Exabyte Storage Shipments Split by SSD, Other Flash, HDDs, and Tape
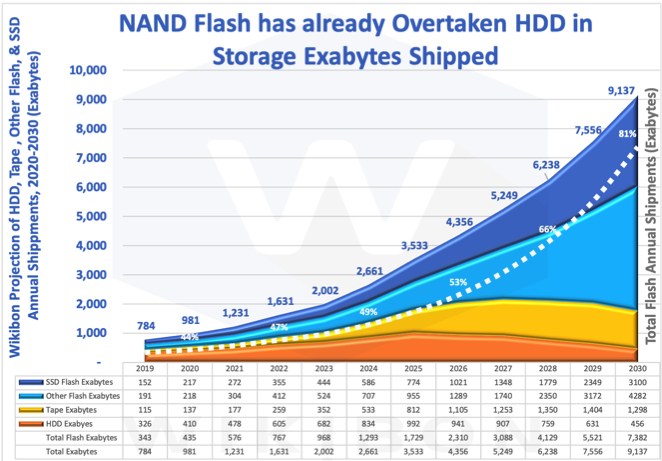
The most important conclusion from Figure 9 is that NAND flash shipments are already greater than HDD shipments by capacity shipped. The table at the bottom of Figure 9 shows that total flash accounted for 435EB in 2020, compared to HDD with 410EB. Most of the “other flash” segment is consumer flash, and the fabs are already built and in production. More will be steadily built over the next decade. The cost of flash includes the investment in flash fabs. Myth exploded.
Exascale Storage Challenges
Introduction
Big data NAS file-system workloads are varied. Animation and visual effects (VFX), media and broadcast applications, large-scale analytic databases, log-file management with Splunk, the huge files in life sciences, AI and deep learning, large-scale Inference AI, large-scale distributed container systems, and extracting data value from backup and recovery systems are just some of the varied workloads.
In the premise, we alluded to big data’s challenges, the exascale storage problem, as one of the last bastions of HDD. HDDs are slow both in bandwidth and in the number of IO/s it can deliver. Historically, HDDs have been lower cost/TB and do not limit how often the data is changed. Addressing exascale with HDD requires high levels of parallelism. Currently, solutions deploy parallel file systems combined with striping data over a large number of HDD disks. Also, multiple tiers of storage are used at different speeds and costs. These systems are complex and fragile in the sense that they need constant attention and tuning.
One way that transactional systems overcome slow storage is the use of multiple tiers and fast, small caches. This approach works well when is data is active and the working set size is not too many times bigger than the cache size. However, caches and tiers do not work well for most big data applications. If used, they severely limit application capability: real-time solutions are practically impossible with multi-tier storage systems.
Single tier storage systems are far simpler in concept, more consistent in performance, and have lower operational and development costs. Single tier systems are ideal for the exascale challenge.
Deep Dive on Exascale Flash Solution (Optional)
There are still problems that need to be addressed when consumer flash is used. Flash is speedy for data reads. However, flash data writes are slower. There is a limited number of times flash can be overwritten. There are different ways to solve this problem – a number of them developed in the traditional storage controller.
Vast Data has addressed this problem using a combination of Intel/Micron XPoint SSDs and consumer QLC SSDs both held in a JBOF (Just a Bunch of flash) configuration. Both are in a consumer U2 form factor. All the writes initially go to 3D XPoint, and the writing of the data to the QLC drives is staged over time to optimize the placement and life of the flash. The reads will go to the QLC or XPoint drives depending on the latest data’s metadata.
The JBOF enclosures hold all issues of state. There is no state held by the storage processors. This architecture allows a single namespace to be distributed.
The architecture also allows the traditional RAID approaches used on HDD drives to be replaced by far more efficient Vast Data’s locally-decodable erasure codes. These ECCs can reconstruct erased data, like the data on a failed SSD drive, using only a small fraction of the surviving data strips. The combination of Optane and flash technologies allow data recovery in minutes or hours compared with days or weeks on HDDs.
The technology to connect the application servers to the storage is NVMe-oF. The NVMe portion is an improved protocol with lower overheads. The primary fabric is converged Ethernet, which combines the HBA and NIC and allows the network to be independent of the processor. The final link in the chain is RoCE, RDMA over Converged Ethernet. RDMA is a Remote Direct Memory Access, a protocol that allows data movement to and from memory independent of the processor. RoCE enables applications data access latency in the 20-microsecond range for data physically close by, a thousand times faster than HDD access. The big data files systems use the NFS3 over RDMA.
Bottom Line: The Vast Data architecture allows a highly-performant simple single-tier system.
Benefits of Exascale Solution
Vast Data is approaching this problem by deploying the lowest cost consumer flash supplemented by 3D XPoint. The addition of NVMe-oF allows the creation of single-tier storage addressed directly by any application server.
This simplicity of this approach reduces the constraints of storage infrastructure in the design and execution of big data applications. The approach also enables the adoption at-scale of new techniques such as ML and real-time analytics.
Introduction
Table 2 above shows the detailed assumptions behind Figure 4 above. You can see that the SSD/HDD $/TB ratio is one in 2026. However, the only workload type suitable for HDD is rarely-read sequential files, when the speed of reading or recovery is of no importance. An example might be uncompressible encrypted video required by governmental agencies for compliance and no other reason. HDD might not win even then, as the lowest cost solution would probably be a tape library.
Earlier Wikibon research found that for higher performance HDDs, the point at which SSDs became generally preferred by enterprises was when the SSD/HDD $/TB ratio goes below 3. This is for workloads where there is some value in faster IO. Table 1 shows that it is likely to occur between 2023 and 2024. That is well within a normal 5-year storage business case.
Also, modern all-flash architectures have evolved and have lowered costs, especially for large-scale system.
Modern Enterprise Flash Architecture
QLC consumer flash SSDs provide the lowest cost of flash storage. However, the number of writes per cell is low (1,000s). There are different methods to overcome this problem, including large amounts of server DRAM storage, caches using other high-write media, or persistent memory media.
Several storage vendors have focused on providing new architectures for flash-only storage. These include IBM with QLC and SLC flash, Pure Storage, which develops all-flash storage hardware and software products including QLC, Silk Cloud Data Software Platform (previously Kaminario), and Vast Data, which produces disaggregated, shared everything, EB-scale all-flash storage systems, and software.
Wikibon picked Vast Data because of its single-tier QLC-only flash solution, multi-exabyte scalable architecture, and a 10-year guarantee on flash.
There are 4 elements of its architecture which uses:
1 Low-cost QLC Consumer SSDs (i.e., single port);
2 Low-latency persistent memory (Intel Optane) SSDs to manage writes and state globally;
3 NVMe-oF commodity scaleable any-to-any storage fabric;
4 Stateless loosely-coupled storage servers in a global namespace with equal access to shared persistent NVMe devices over NVMe-oF.
This all-flash infrastructure architecture enables stateless storage servers to eliminate cluster cross-talk IO request coordination. As a result, the architecture scales better, provides consistent and fast performance (i.e., it is cacheless), and is more resilient than any HDD legacy scale-out architecture. Besides, it is lower-cost than HDD systems for most workloads.
The most important benefit of this architecture for any datacenter or cloud vendor is simplicity. There is an any-to-any connection between any server to any storage device. There is no need to move data about for performance or cost reasons, and almost no impact of one user with another (no noisy neighbors). The support team’s focus is only on end-user support. No staff with deep expertise is required for complex tuning, striping, or cache management. All the management of media life is performed automatically by the storage system.
Factors Affecting an HDD vs. SSD Business Case
NAND flash has the following advantages over HDD:
• It is smaller and lighter in size and weight. A 15GB U2 form factor SSD takes 6.4 cubic inches in space. A 14TB or 16TB, 3.5 inch HDD takes 161 cubic inches, 25 times more than flash. This difference is increasing over time.
• Flash is electronic and has no moving parts. HDD has spinning platters and heads that move across the disk. HDDs need to be replaced every 5 years.
• It decays at a known rate, which can be monitored. HDD fails with no warning, especially as they get older.
• Flash is resilient to vibrations and falls and is suitable for many mobile consumers and IoT devices.
• It is much faster, and therefore easier to write programs to support reasonable response times.
• Flash is easier to program, easier to maintain, has lower maintenance costs, lasts 10 years or longer, and has lower energy costs.
• It can be depreciated over 10 years.
• Flash requires less physical storage, which lowers software costs charged by terabyte.
• Applications running with flash requires fewer processor cores, which lowers the cost of most database software and many file-based applications such as Splunk.
Business Cases HDD vs. Consumer QLC flash
Methodology
Table 3: Big Data Mission
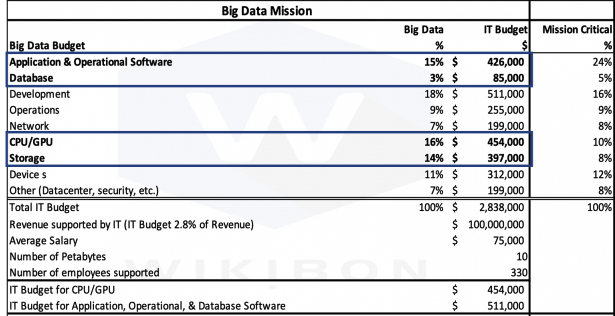
Wikibon has created a detailed HDD and QLC flash storage solution model for a 10PB storage requirement growing at 30% per year. The model assumes a global file system for a large number of files. This model is in support of a big data mission.
Table 3 shows the IT budget for this big data mission. The revenue supported by this mission is assumed to be $100 million, the number of employees 330, and the total IT budget is $2.8 million. The last column shows the allocation of the IT budget. The reason for this table is that choice between flash and HDD storage affects all IT budget items.
Wikibon built 10-year and 5-year business cases, taking into account the storage cost projections from Table 2 above. The detailed model is shown in the footnotes in Table 7. The model builds a system from the parts: storage units, storage server units, storage network units, and the racks and space to hold the units. It is built up from an SSD and HHD starting point and the other parts of the solution on top of that.
The top half of Table 7 builds a QLC flash solution using the Vast Data architecture discussed above. The second half of Table 4 builds an HDD solution using the densest HDD architecture possible, starting with 12TB HDDs.
The model includes a benefit from the speed of flash to users and developers of applications that use this data. It is applied as a 20% increase in chargeback or showback. It also includes the software budget benefits because fewer CPU/GPUs are required because of faster storage operations. Software such as Splunk and database is often related to the number of CPU cores.
The 10-year business case is a strategic view. To allow a more tactical evaluation, a 5-year business case is also derived from the same data.
10-Year IT Business Case for All QLC Flash Vs. HDD
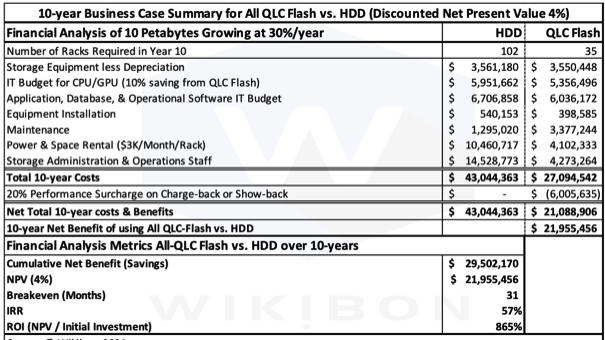
Figure 10 shows the 10-year IT business case of an all QLC flash solution vs. a traditional HDD solution. The y-axis shows the 10-year cost components of a 10 Petabyte storage requirement growing at 30%/year.
The simplicity of the single-tier flash solution, together with far fewer racks to manage (19 vs.102, see Table 4 below), are the reasons that fewer people are required at a lower salary. Again, the power and space requirements are much lower for the all QLC flash solution because of the huge reduction in racks required. The equipment installation costs are also much smaller because of the fewer number of racks.
The application license benefit is estimated at a conservative 10% benefit. Because less physical storage, servers, and server cores are required with all QLC flash solution, these software costs are lower.
The all QLC flash solution’s equipment costs are shown as equipment less the depreciation at the end of the 10-year period. The amount is $1.1 million (see Table 4) because the flash storage is fully functional and guaranteed for 10 years and can be depreciated over a longer period.
The cost of storage and maintenance of the all QLC flash solution equipment is higher than the HDD alternative. However, the overall cost is much lower. Figure 10 shows that the overall saving is $39.5 million (76%) over 10 years compared with the HDD solution.
There is significant value to the user and developers using the flash storage because flash is much faster than HDD. End-users and customers are more efficient with faster response times. Developers are more efficient in development because of a faster turnaround. Developers also need less time to ensure good response times to the end-users.
However, the exact calculation of these benefits depends on the specific workload requirements. Wikibon has put this value in IT terms by putting in a surcharge of 20% for the QLC all-flash solution. Wikibon believes this is justified, and in almost all cases, the end-users will be delighted to pay for the additional functionality of flash-only. The benefit is shown in Figure 10, $3.5 million.
Figure 10: 10-year IT Business Case for All QLC-Flash vs. HDD with an In-Line Data-Reduction Factor of 2.0 for QLC flash
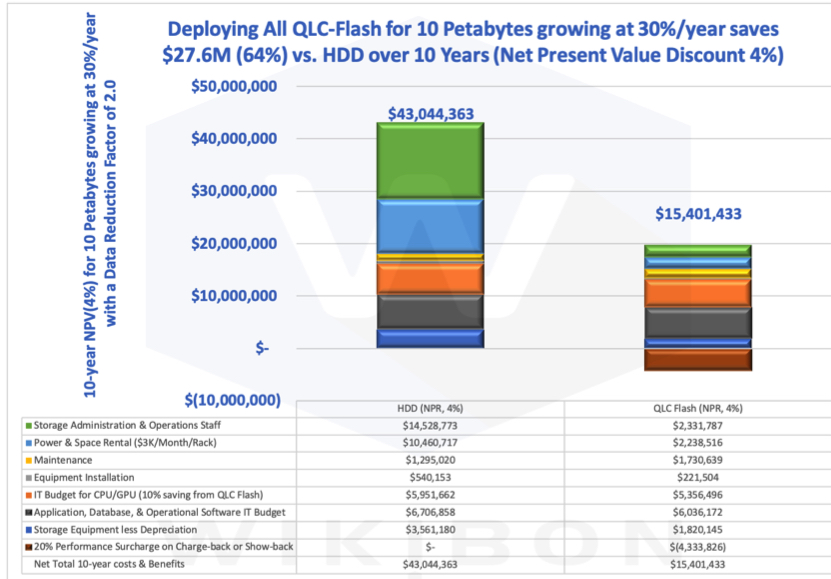
The source of the data in Figure 10 above in Table 3 below, which in turn is taken from the detailed model in Table 7 in the footnotes. The financial analysis shows a net present value of $27.6 Million. The breakeven is 10 months and the IRR (Internal Rate of Return) is 149%.
The reason for showing the year case is to look at the strategic changes in the all QLC flash solution’s cost over this period. The breakeven of under 1 year is positive. The IRR is not as high as might be expected because of the back-end weighting of the benefits. However, Wikibon believes the overall 10-year IT financial case is strong. The 5-year view is shown in the next section.
Table 4: 10-Year IT Business Case for All QLC-Flash Vs. HDW With In-Line Data-Reduction Factor of 2.0 for QLC Flash
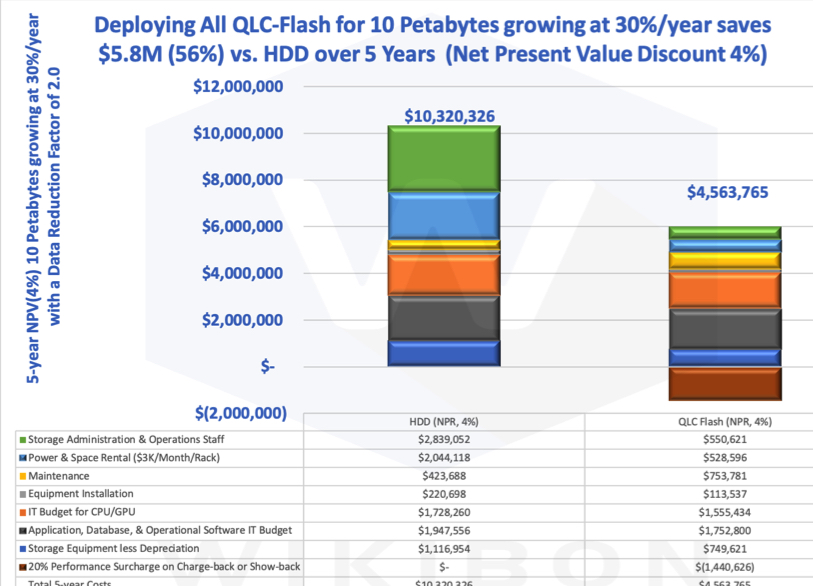
Figure 9 shows the 5-year IT businesscase of an a0ll QLC flash solution vs. traditional HDD solution. The y-axis shows the 10-year cost components of a 10 Petabyte storage requirement growing at 30%/year.
The simplicity of the single-tier flash solution, together with far fewer racks to manage (6 vs. 26, see Table 5 below), are the reasons that fewer people are required at a lower s,ry. Again, the power and space requirements are much lower for the all QLC flash solution because of the large reduction in racks required. The equipment installation costs are also smaller because of the few racks.
The benefit of storage administrative software is priced at a very modest 10% benefit to the software budget, as shown in Table 3. Because less physical storage and fewer server cores are required with the all QLC flash solution, these software costs are lower.
The all QLC flash solution’s equipment costs re shown as equipment less the deprecition at the end of the 10-year period. The depreciation value at the end of 5 years $1.9 million (see Table 4) because the flash storage is fully functional and guaranteed or 10 years and can be depreciated ove a longer period.
The cost of storage and maintenance of the all QLC flash solution equipment is higher than the HDD alternative. However, the overall cost is much lowr. Figure 11 shows that the overall saing is $5.8 million (56%) over 5 years compared with the HDD solution.
Figure 11: 5-Year IT Business Case for All QLC-FlasVvs. HDD With In-Line Data-Reduction Factor of 2.0 for QLC Flash
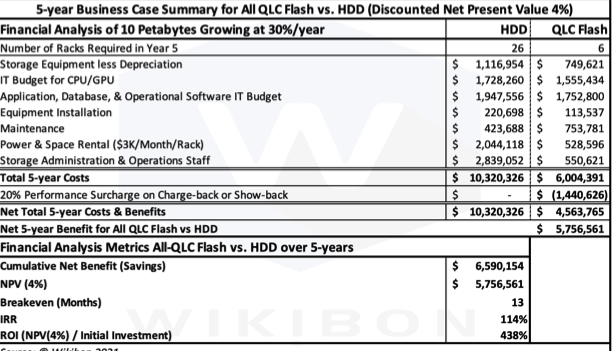
Table 5 below is the source, the data in Figure 11 above, taken from the detailed model in Table 7. The financial analysis shows a net present value of $5.8 Million. The breakeven is 13 months, and the IRR (Internal Rate of Return) is 114%.
The breakeven and IRR are not as overwhelming as expected from the 5.8 million cost savings because of the benefits’ back-end weighting. However, Wikibon believes the overall 5-year financial case is strategically sound.
Table 5: 5-year IT Business Case for All QLC-Flash Vs. HDD with In-Line Data-Reduction Factor of 2.0 for QLC Flash
Thee is significant value to the user and developers using the flash storage because flash is much faster than HDD. End-users and customers are mre efficient with faster response time. Developers are more efficient in development because of a faster turnaround. Developers also need less time to ensure good response times to the end-users.
However, the exact calculation of these benefits depends on the specific workload requirements. Wikibon has put this value in IT terms by putting in a surcharge of 20% for the all QLC flash solution. Wikibon believes this is justified, and in almost all cases, the end-users will be delighted to pay for the additional function. The benefit is shown in Figure 11 is $1.4 million.
IT Business Case With No Data Reduction
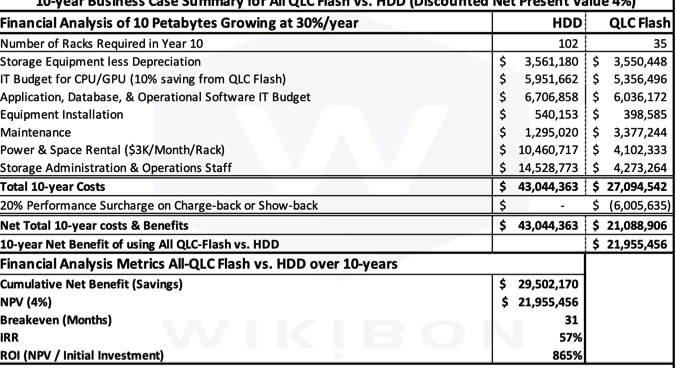
Table 6 below shows the 10-year business with no data reduction benefit for all-QLC flash. The costs for the HDD remain the same at $43 million over 10 years. The costs of the QLC flash are about $6 million higher. The overall business case is still positive, but the breakeven of 31 months and the IRR of 57% would be less compelling for a CFO.
However, the IT business benefits of at least 2.4% improved productivity for the 330 staff in the big data are still compelling. The business value of that improvement would be about $24 million over 10 years, in addition to the cumulative IT benefits.
Table 6: 10-year IT Business Case for All QLC-Flash Vs. HDD With an In-Line Data-Reduction Factor of 1.0 for QLC Flash (no Data Reduction)
Overall Business Case
The IT financial analyses of all the above scenarios are positive. However, there are additional financial benefits to the line of business. Table 3 above shows that the number of staff is 330 and the revenue supported by this big data mission for the enterprise is $100 million.
The business value to improved productivity is calculated as 2.4%. The benefits of flash to the productivity of end-users dedicated to big data are much higher. The data architecture makes it easy to find or perform analyses on any dataset, and the faster response times lead to greater productivity and improve big data solutions. Wikibon’s very conservative estimate is an improvement of 5% to revenue contribution, which would be $5 million x 10 years less ~ $4 million for additional 20% surcharge payments to IT = $46 million. These are definitely “soft” dollars and less interesting to the CFO. However, Wikibon argues that these benefits are more important to the heads of the big data line of business than the IT benefits.
The benefits of a higher-performant simpler data platform will make data transformation easier for any organization.
Conclusions
Because of growing consumer volumes for flash, Wikibon believes that flash solutions will quickly dominate storage for consumers and slowly dominate enterprise use in private clouds and public clouds over the next 5-years.
The challenge for HDD vendors is introducing new technology at a lower price point ($/TB) than existing technology. Some 16TB HAMR drives are installed in cloud vendors, and recently some 20TB HAMR drives.
However, the math of Wright’s Law is unforgiving. The HDD vendors have not committed to volume production of HAMR or MAMR. And the reason is simple – they will lose money, a lot of money. The historic expanding HDD market has disappeared. In a declining HDD market, the volumes no longer exist for technology suppliers of platters, actuator motor,and actuator heads to drive down the learning curves.
Wikibon projects that the main buyers of HDD drives will be cloud providers. The benefits of larger HDDs are real, but only if the price is right. flash SSD is already delivering SSD with over five times the capacity and many times the performance (10-1,000 times see Table 9 in the Footnotes below).
Wikibon believes that HAMR and MAMR technologies are unlikely to deliver in full production volumes. Wikibon believes that vendors will provide a maximum of 24-28TB per HDD, using current PSR tecnology. Table 1 shows the Wikibon projections for HDDs and HDD exabytes. It projects that HDD vendors will sell an increasing percentage of the largest HDDs, increasing revenue and EBs delivered and sustain business operations.
Wikibon believes that NAND flash will be the primary source of innovation for consumers and the datacenter. With the arrival of additional NAND capacity from China, Wikibon projects, there will be sufficient flash capacity for consumer and datacenter demands. If there is a shortage, flash prices will rise. Consumer flash is more price-sensitive than enterprise flash, and enterprises can ensure sufficient NAND flash supply.
Tape libraries are the lowest cost storage, and tape technologies have continued to improve density.
This research also confirms that Vast’s architecture can deliver enterprise flash solutions at a lower overall price than HDD storage. This architecture has also enabled a highly simplified, low-cost, single-tier, scale-out, and flash-based storage layer. This approach eliminates the costs and complexity of tiered storage and makes it easier to manage and automate. Of course, there are caveats; not every workload will see the same benefits.
Wikibon expects cloud vendors and other storage vendors to replicate the Vast-type architecture. Wikibon envisions there will be multiple single-tier offerings at different performance, functionality, and price points.
Enterprises should expect to have multiple pools of single-tier storage and should ensure that data shared by a portfolio of applications can remain there for life. HDD data can also be single-tier storage for suitable application portfolios.
Wikibon recommends that private and public clouds adopt a strategic plan to implement the type of high-performance disaggregated storage architecture created by Vast. This should be part of an overall data-driven strategy. The faster and more consistent performance of flash-based systems should drive increasingly real-time applications that will focus on removing asynchronous business processes.
Action Item
Senior IT management should ignore vendor claims of new HDD technologies “just around the corner.” They should assume that flash technology will dominate. For large-scale storage & big data projects, they should implement VAST-like single-tier architectures and position storage investments to combine performance and automated management. This will be an important enabler of a real-time data-led business strategy that enables real-time applications focused on removing asynchronous business processes.


 Subscribe to our free daily newsletter

