


NetApp: Fiscal 2Q21 Financial Results
Net Appears to be $137 milllion, revenue being up 3% Q/Q and Y/Y.
This is a Press Release edited by StorageNewsletter.com on December 2, 2020 at 1:58 pm| (in $ million) | 2Q20 | 2Q21 | 6 mo. 20 | 6 mo. 21 |
| Revenue | 1,371 | 1,416 | 2,607 | 2,719 |
| Growth | 3% | 4% | ||
| Net income (loss) | 243 | 137 | 346 | 214 |
NetApp, Inc. reported financial results for the second quarter of fiscal year 2021, which ended on October 30, 2020.
“In the second quarter, NetApp again delivered strong results, successfully executing vs. our plan to scale our cloud business while growing in the storage market. We also introduced significant new products and services which further advance our Data Fabric strategy,” said George Kurian, CEO. “We are a primary beneficiary of the increasing importance of data and are uniquely positioned to help customers with their digital transformations. I am confident in our ability to drive long-term growth, extend our hybrid cloud leadership, and deliver value for customers, partners, and shareholders.”
2FQ21 Financial Results
• Net Revenues: $1.42 billion, compared to $1.37 billion in 2FQ20
• Net Income: GAAP net income of $137 million, compared to GAAP net income of $243 million in 2FQ20; non-GAAP net income2 of $236 million, compared to non-GAAP net income of $257 million in 2FQ20
• Earnings per Share: GAAP net income per share3 of $0.61 compared to GAAP net income per share of $1.03 in 2FQ20; non-GAAP net income per share of $1.05, compared to non-GAAP net income per share of $1.09 in 2FQ20
• Cash, Cash Equivalents and Investments: $3.65 billion at the end of 2FQ21
• Cash Provided By (Used In) Operations: $161 million, compared to $(53) million in 2FQ20
• Dividend: Returned $107 million to shareholders through cash dividend
3FQ21 Outlook
- Net revenues expected to be in the range of $1.34 billion to $1.49 billion
- GAAP earnings per share in the range of $0.67-$0.75
- Non-GAAP earnings in the range of $0.94-$1.02
Comments
Revenue, operating margin and all exceeds guidance.
Sales are up 3% Q/Q and Y/Y and the company is profitable since 3FQ18. It's increasing during last two 3-month periods after four quarters of decrease.
3FQ21 billings are $1.46 billion, up 10% Y/Y. This is the second straight quarter of yearly billings growth.
The firm ended current quarter with $3.7 billion in deferred revenue, an increase of 5% Y/Y.
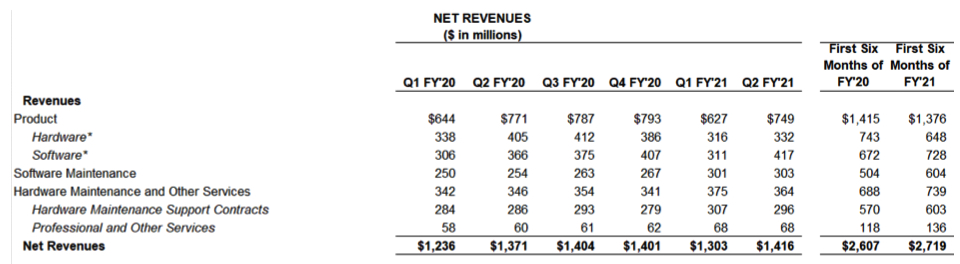
Revenue per business
Cloud services ARR (annualized run rate) grew to $216 million, up 200% Y/Y. Cloud services dollar-based net retention rate is at 207%, with the mix of new cloud services customers and growth at existing customers.
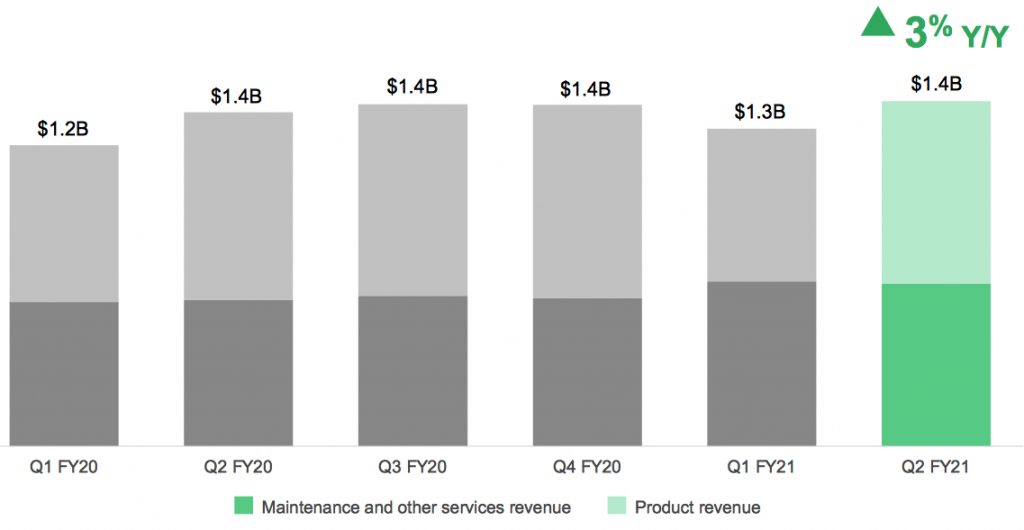
When combined, software revenue and recurring maintenance and cloud revenue totaled $1 billion, and increased 12% year-over-year, representing 72% of total revenue.
Software product revenue of $417 million increased 14% Y/Y, driven by an increase in mix of high-end AFAs. Recurring maintenance and cloud revenue of $599 million was up 11% Y/Y, constituting over 42% of total net revenue.
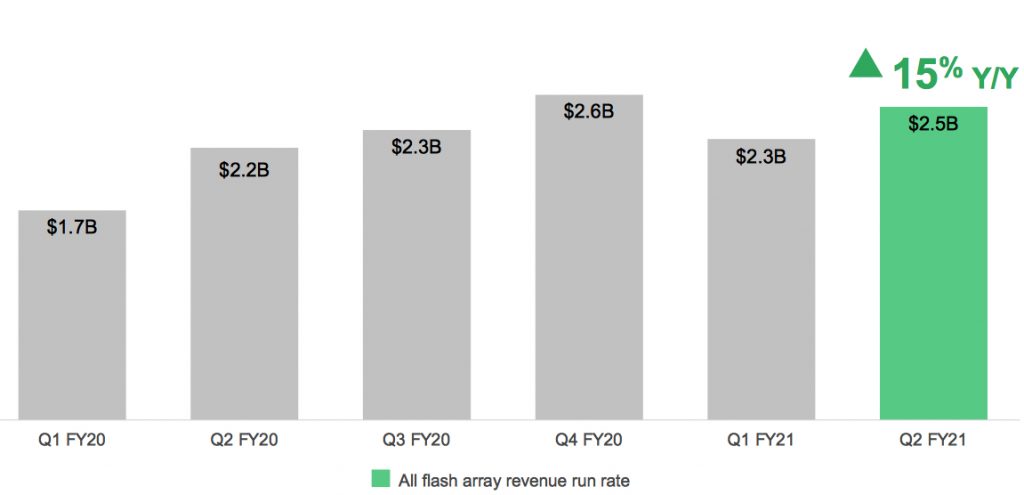
AFA business grew 15% Y/Y at $632 million to a ARR of $2.5 billion. At the end of 2FQ21, 26% of installed systems were all-flash, with continued growth by converting installed base, in addition to get new customers. Growth in AFA drove momentum in software product revenue, which increased 14% Y/Y, and recurring maintenance and cloud revenue, which increased 11% from last year.
AFA run rate
NetApp expect 3FQ21 net revenue between $1.34 billion and $1.49 billion, which, at the midpoint, implies a 1% increase in revenues Y/Y.
NetApp's financial results since FY16
| Fiscal Period | Revenue | Y/Y Growth | Net income (loss) |
| FY16 | 5,546 | -9% | 229 |
| FY17 | 5,519 | -0% | 509 |
| 1Q18 | 1,325 | -11% | 136 |
| 2Q18 | 1,422 | 7% | 175 |
| 3Q18 | 1,523 | 7% | (506) |
| 4Q18 | 1,641 | 8% | 271 |
| FY18 | 5,911 | 7% | 75 |
| 1Q19 |
1,474 | 12% |
283 |
| 2Q19 |
1,517 | 7% |
241 |
| 3Q19 |
1,563 | 2% |
319 |
| 4Q19 |
1,592 | -3% |
296 |
| FY19 |
6,146 | 4% |
1,169 |
| 1Q20 |
1,236 | -16% | 103 |
| 2Q20 |
1,371 | -10% | 243 |
| 3Q20 |
1,404 | -10% | 277 |
| 4Q20 |
1,401 | -12% | 196 |
| FY20 |
5,412 | -12% |
819 |
| 1Q21 |
1,303 |
5% |
77 |
| 2Q21 |
1,416 |
3% |
137 |
| 3Q21* |
1,340-1,490 |
-5%/+5% |
NA |
Revenue and net income (loss) in $ million
* Outlook


 Subscribe to our free daily newsletter


