


Dell: Fiscal 2Q21 Financial Results
Storage revenue at $4 billion, down 4% Y/Y, up 5% Q/Q, fourth consecutive quarter yearly decline
This is a Press Release edited by StorageNewsletter.com on August 31, 2020 at 2:14 pmFor storage only
| (in $ million) | 2FQ20 | 2FQ21 | 6 mo. 20 |
6 mo. 21 |
| Revenue | 4,184 | 4,011 | 8,206 | 7,822 |
| Growth | -4% | -5% |
Dell Technologies, Inc. announces financial results for its fiscal 2021 second quarter ended July 31, 2020.
2FQ21 global revenue was $22.7 billion down 3% Y/Y.
Infrastructure solutions group sales were $8.2 billion, down 5%.
Infrastructure solutions group
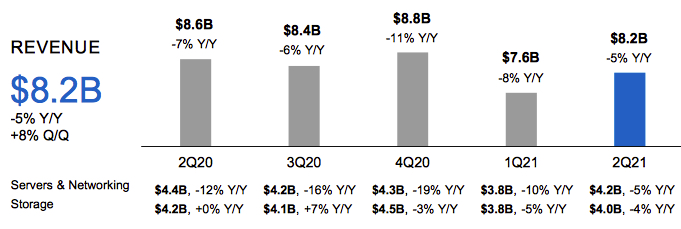
Storage revenue was $4 billion, down 4% Y/Y but up 5% sequentially, a relatively good spot given the macro environment, but this the fourth consecutive quarter with Y/Y storage revenue decline. It has especially disappointing storage sales for the former 3-month period: $3,758 million, -7% Y/Y and -16% Q/Q.
Per comparison, for vendor’s latest fiscal periods, storage revenue of HPE, NetApp, Pure Storage were Y/Y -10%, 5% and 2%, respectively.
The strong demand for VxRail continued for data protection and VxRail in 2FY21 and mid-single-digit orders growth for high-end storage, triple-digit orders growth in high-end PowerMax solution and double-digit orders growth in data protection. It continues to build pipeline for PowerStore and is pleased with its customer receptivity. It expects it to ramp through 2FH21 and heading into FY22.
The vendor saw softness in other areas of core storage, including mid-range.
For IDC, Dell EMC maintained the #1 position with 33.6% share in hyperconverged systems, external enterprise storage with 32.1%, in storage software with 13.8%, and in purpose-built backup appliance with 57%.
Jeff Clarke, vice chairman and COO, said notably about expectations: “As we look into next year, we see growth in the server market and the external storage market.”
Storage revenue of Dell
(in $ million)
| Period | Revenue | Y/Y growth |
| FY11* |
2,295 |
5% |
| FY12* |
1,943 |
-15% |
| FY13* |
1,699 |
-13% |
| FY14* |
1,518 |
-11% |
| FY15* |
1,437 |
-5% |
| FY16* |
2,217 |
54% |
| FY17** |
8,942 |
303% |
| FY18 | 15,254 |
+71% |
| 1FQ19 | 4,082 | +10% |
| 2FQ19 | 4,166 | +13% |
| 3FQ19 | 3,883 | +6% |
| 4FQ19 | 4,636 | +7% |
| FY19 | 16,767 | +10% |
| 1FQ20 | 4,022 | -1% |
| 2FQ20 | 4,184 | 0% |
| 3FQ20 | 4,184 | +8% |
| 4FQ20 | 4,487 | -3% |
| FY20 | 16,767 | -0% |
| 1FQ21 |
3,758 | -7% |
| 2FQ21 |
4,011 | -4% |
* Without EMC
**without EMC for 1FQ17 and 2FQ17 following acquisition for $63 billion


 Subscribe to our free daily newsletter


