


Backblaze Tested 139,867 HDDs in 2Q20
Lowest historical annualized failure rate of 0.81% vs. 1.07% in 1Q20, no failure on Toshiba 4TB drives since 4Q18
This is a Press Release edited by StorageNewsletter.com on August 20, 2020 at 2:15 pm This report was published on the blog of Backblaze, Inc. on August 18, 2020, written by Andy Klein, director of compliance.
Backblaze Hard Drive Stats 2Q20
As of June 30, 2020, Backblaze had 142,630 HDDs in our cloud storage ecosystem spread across four data centers.
Of that number, there were 2,271 boot drives and 140,059 data drives. This review looks at the 2Q20 and lifetime hard drive failure rates of the data drive models currently in operation in our data centers and provides a handful of insights and observations along the way. `
Quarterly Hard Drive Failure Stats for 2Q20
At the end of 2Q20, Backblaze was using 140,059 hard drives to store customer data. For our evaluation we remove from consideration those drive models for which we did not have at least 60 drives (see why below). This leaves us with 139,867 hard drives in our review. The table below covers what happened in 2Q20.
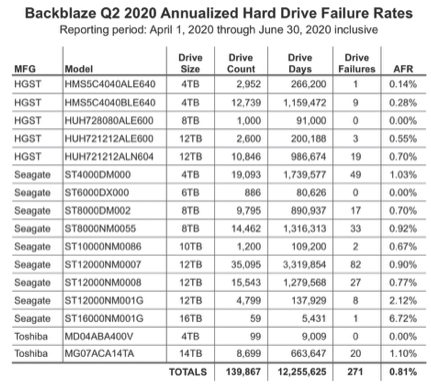
Notes and observations
The Annualized Failure Rate (AFR) for 2Q20 was 0.81% versus 1Q20 which was 1.07%. The Q2 AFR number is the lowest AFR for any quarter since we started keeping track in 2013. In addition, this is the first time the quarterly AFR has been under 1%. One year ago (2Q19), the quarterly AFR was 1.8%.
During this quarter, 3 drive models had 0 (zero) drive failures: the Toshiba 4TB (model: MD04ABA400V), the Seagate 6TB (model: ST6000DX000) and the HGST 8TB (model: HUH728080ALE600).
While the Toshiba 4TB drives recorded less than 10,000 drive days, we have not had a drive failure for that model since 4Q18, or 54,054 drive days. In comparing drive days with the Toshiba drive, the Seagate 6TB and HGST 8TB drives are just as impressive, having no failures in the quarter yet recording 80,626 and 91,000 drive days respectively in 2Q20.
There were 192 drives (140,059 minus 139,867) that were not included in the list above because we did not have at least 60 drives of a given model. For example, we have: 20 Toshiba 16TB drives (model: MG08ACA16TA) we are putting through our certification process.
On the other end of the spectrum, we still have 25 HGST 4TB drives (model: HDS5C4040ALE630), putting in time in Storage Pods. Observant readers might note the model number of those HGST drives and realize they were the last of the drives produced with Hitachi model numbers.
Reminiscing aside, when we report quarterly, yearly, or lifetime drive statistics, those models with less than 60 drives are not included in the calculations or graphs. We use 60 drives as a minimum as there are 60 drives in all newly deployed Storage Pods. Note: The Seagate 16TB drive (model: ST16000NM001G) does show 59 drives and is listed in the report because the one failed drive had not been replaced at the time the data for this report was collected.
That said, all the data from all of the drive models, including boot drives, is included in the files which can be accessed and downloaded on our Hard Drive Test Data webpage.
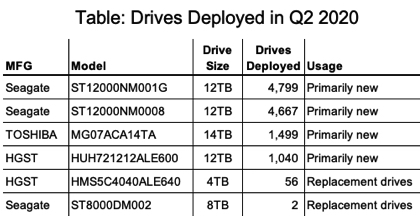
What We Deployed in 2Q20
We deployed 12,063 new drives and removed 1,960 drives via replacements and migration in 2Q20, giving us a net of 10,103 added drives. Below is a table of the drive models we deployed.
Quarterly Trends by Manufacturer
Quarterly data is just that, data for only that quarter. At the beginning of each quarter we wipe out all the previous data and we start compiling new information. At the end of the quarter, we bundle that data up into a unit (collection, bag, file, whatever), and name it; 2Q20, for example. This is the type of data you were looking at when you reviewed the Quarterly Chart for 2Q20 shown earlier in this report. We can also compare the results for a given quarter to other quarters, each their own unique bundle of data. This type of comparison can reveal trends that can help us identify something that needs further attention.
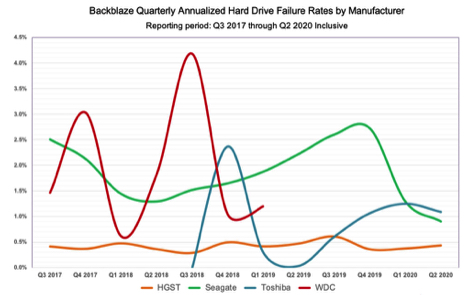
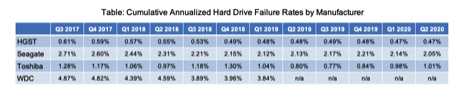
The chart below shows the AFR by manufacturer using quarterly data over the last three years. Following the chart is 2 tables. The first is the data used to create the chart. The second is the count of the number of hard drives corresponding to each quarter for each manufacturer.
Notes
1. The data for each manufacturer consists of all the drive models in service which were used to store customer data. There were no boot drives or test drives included.
2. The 0.00% values for the Toshiba drives from 3Q17 through 3Q18 are correct. There were no Toshiba drive failures during that period. Note, there were no more than 231 drives in service at any one time during that same period. While zero failures over 5 quarters is notable, the number of drives is not high enough to reach any conclusions.
3. The “n/a” values for the WDC drives from 2Q19 onward indicate there were zero WDC drives being used for customer data in our system during that period. This does not consider the newer HGST drive models branded as WDC as we do not currently have any of those models in operation.
Observations
1. WDC: The WDC data demonstrate how having too few data points (i.e. hard drives) can lead to a wide variance in quarter to quarter comparisons.
2. Toshiba: Just like the WDC data, the number of Toshiba hard drives for most of the period is too low to reach any decent conclusions, but beginning in 4Q19, that changes and the data from then on is more reliable.
3. Seagate: After a steady rise in AFR, the last 2 quarters have been kind to Seagate, with the most recent quarter (AFR=0.90%) being the best we have ever seen from Seagate since we started keeping stats back in 2013. Good news and worthy of a deeper look over the coming months.
4. HGST: With the AFR fluctuating between 0.36% and 0.61%, HGST drives win the prize for predictability. Boring, yes, but a good kind of boring.
Cumulative Trends by Manufacturer
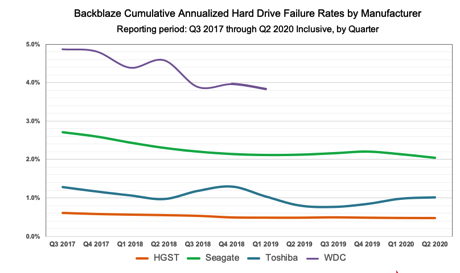
As opposed to quarterly data, cumulative data starts collecting data at a given point and new data is added until you stop collecting. While quarterly data reflects the events that took place during a given quarter, cumulative data is everything about our collection of hard drives over time. Using cumulative data, we can see longer term trends over the period, as in the chart below, with the data table following.
Down and to the Right
For all manufacturers, you can see a downward trend in AFR over time. While this is a positive occurrence, we do want to understand why and incorporate those learnings into our overall understanding of our environment—just like drive failure, drive ‘non-failure’ matters too. As we consider these findings, if you have any thoughts on the subject, let us know in the comments. Maybe you think hard drives are getting better, or is it more likely that we’ve added so many new drives in the last three years that they dominate the statistics, or is it something else? Let us know.
Lifetime Hard Drive Failure Rates
The table below shows the lifetime AFR for the hard drive models we had in service as of June 30, 2020. The reporting period is from April 2013 through June 30, 2020. All of the drives listed were installed during this timeframe.
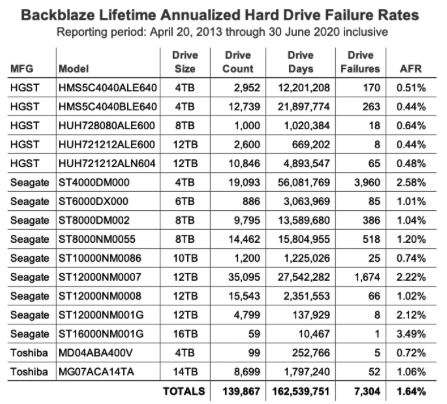
Notes and Observations
The lifetime AFR was 1.64%, the lowest since we started keeping track in 2013. In addition, the lifetime AFR has fallen from 1.86% in 2Q18 to the current value, even as we’ve passed milestones like an exabyte of storage under management, opening a data center in Amsterdam, The Netherlands, and nearly doubling the size of the company.
Busy 2 Years
All of the Seagate 12TB drives (model: ST12000NM001G) were installed in 2Q20, so while we have a reasonable amount of data, as a group these drives are still early in their lifecycle. While not all models follow the bathtub curve as they age, we should wait another couple of quarters to see how they are performing in our environment.
The Seagate 4TB drives (model: ST4000DM000) keep rambling along. With an average age of nearly 5 years, they are long past their warranty period (1 or 2 years depending on when they were purchased). Speaking of age, the drive model with the highest average age on the chart is the Seagate 6TB drive at over 64 months. That same model had zero failures in 2Q20, so they seem to be aging well.
If you just want the summarized data used to create the tables and charts in this blog post you can download the Zip file containing the MS Excel spreadsheet.


 Subscribe to our free daily newsletter


