


Seagate: Fiscal 4Q20 Financial Results Results
Revenue flat in FY20 as well as expected in FY21
This is a Press Release edited by StorageNewsletter.com on July 30, 2020 at 1:57 pm| (in $ million) | 4Q19 | 4Q20 | FY19 | FY20 |
| Revenue | 2,371 | 2,517 | 10,390 | 10,509 |
| Growth | 6% | 1% | ||
| Net income (loss) | 983 | 166 | 2,012 | 1,004 |
4FQ20 Highlights
• Revenue of $2.52 billion
• GAAP operating margin of 10.6%; non-GAAP operating margin of 14.8%
• GAAP diluted earnings per share (EPS) of $0.64; non-GAAP diluted EPS of $1.20
• Cash flow from operations of $388 million and free cash flow of $274 million
• Revenue from mass capacity storage markets increased 35% Y/Y and represented 63% of 4FQ20 HDD revenue
FY20 Highlights
• Revenue of $10.51 billion
• GAAP operating margin of 12.4%; non-GAAP operating margin of 14.7%
• GAAP diluted EPS of $3.79; non-GAAP diluted EPS of $4.95
• Cash flow from operations of $1.7 billion and free cash flow of $1.1 billion
• Returned $1.5 billion to shareholders through dividends and share repurchases
• Revenue from mass capacity storage markets increased 25% Y/Y and represented 57% of annual HDD revenue
Seagate Technology plc reported financial results for its fourth quarter and fiscal year ended July 3, 2020.
“The June quarter was led by robust cloud and data center demand, which drove record exabyte shipments for our nearline mass capacity drives and strongly contributed to the company’s overall revenue and solid free cash flow gen. However, continued economic uncertainty and Covid-19 related disruptions impacted demand in other key end markets including video and image applications, mission critical and consumer markets and also impacted profitability as we incurred higher logistics and labor costs which together weighed on our fourth quarter results,” said Dave Mosley, CEO. “We are focused on managing the business well and executing on what we can control. FY20 marked a strong year of progress as we grew mass capacity storage revenue by 25% and increased our overall revenue. We executed our technology roadmap, strengthened our balance sheet and delivered on our capital return program. Entering FY21, the level of macro uncertainty remains high and we will continue to carefully manage our cash and expenses. However, we anticipate demand across our end markets to improve within the next 6 months and currently model revenue to be fairly flat in FY21, supported by the strength of our mass capacity product portfolio. Longer-term, the unabated growth in data at the edge and in the cloud is driving secular demand for mass capacity storage and we believe Seagate’s financial strength and innovative product portfolio position us well for these trends.“
The company generated $388 million in cash flow from operations and $274 million in free cash flow during the fiscal fourth quarter 2020. For FY20, the company generated $1.7 billion in cash flow from operations and $1.1 billion in free cash flow.
Seagate maintained a healthy balance sheet and during the 4FQ20, the company paid cash dividends of $168 million and repurchased 1.1 million ordinary shares for $55 million.
The company restructured debt, increasing average debt maturity to nearly 7 years and reduced the amount payable in the next 2 fiscal years to approximately 6% of principal debt balance.
The company ended the fiscal year with cash and cash equivalents of $1.7 billion. There were 257 million ordinary shares issued and outstanding as of the end of the fiscal year.
Quarterly Cash Dividend
The board of directors declared a quarterly cash dividend of $0.65 per share, which will be payable on October 7, 2020 to shareholders of record as of the close of business on September 23, 2020. The payment of any future quarterly dividends will be at the discretion of the board and will be dependent upon Seagate’s financial position, results of operations, available cash, cash flow, capital requirements and other factors deemed relevant by the board.
Business Outlook for 1FQ21
• Revenue of $2.3 billion, plus or minus $200 million
• Non-GAAP diluted EPS of $0.85, plus or minus $0.15
Comments
Quarterly revenue of $2.52 billion is up 6% Y/Y and down 7% Q/Q.
It's not going to be much better next quarter as the company expected sales at $2.3 billion, ±$200 million, amidst the deteriorating demand environment across several key end markets, coinciding with Covid-19 related economic.
It negatively impacted EPS by an estimated $0.25-$0.30 and resulted in lower demand in certain key end markets and higher costs (logistics, labor, under-utilization costs).
Following dismal 4FQ20 results and bleak 1Q21 guidance, shares of Seagate were down more than 10% in the pre-market trading on July 29.
HDD product mix trends
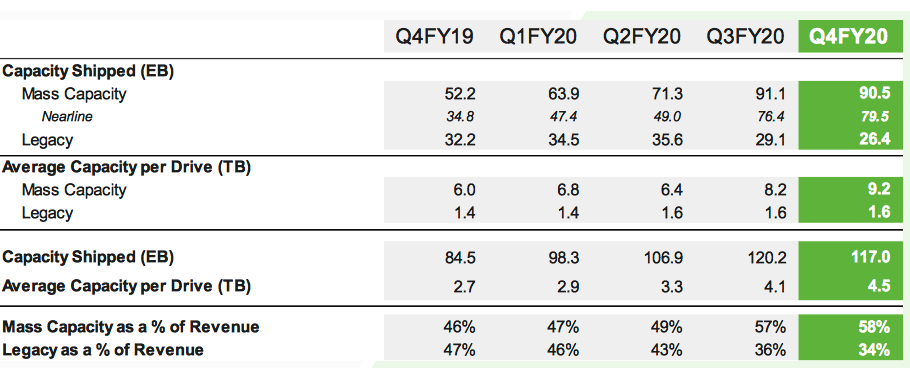
Mass capacity storage includes nearline, video and image applications and NAS. Legacy markets include mission critical, desktop, notebook, digital video recorders, gaming consoles and consumer applications.
Despite tough business conditions, Seagate grew revenue and exabyte shipments in FY20, supported by strong demand for mass capacity storage. Revenue from this market increased 25% Y/Y with exabyte shipments up 57%.
Quarterly mass capacity revenue trend
Up 35% Y/Y (4FQ19 /4FQ20)
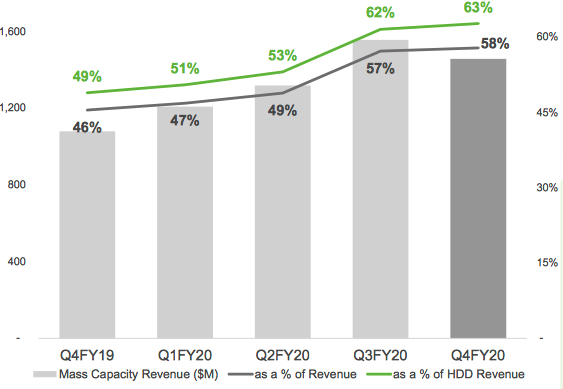
Mass capacity storage includes nearline, video and image applications and NAS
Annual mass capacity revenue trend
16% CAGR (FY16 - FY20)
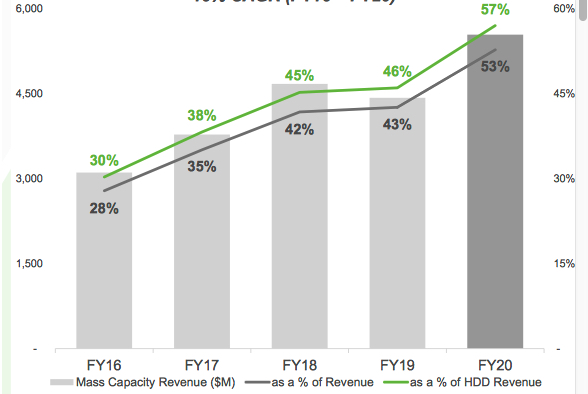
Mass Capacity storage includes nearline, video and image applications and NAS
Mass capacity now represents 58% of the Seagate's global revenues up from 46% one year ago and 24% five years ago, and also 63% of HDD revenue, up from 49% of in the year ago period.
The Californian firm believes the mass capacity storage stand will nearly double over the next 5 years, growing from approximately $12.5 billion in the last 12 month period to around $24 billion by calendar year 2025.
The manufacturer is confident in long-term secular demand for mass capacity storage with estimated TAM of ~$24 billion in CY25.
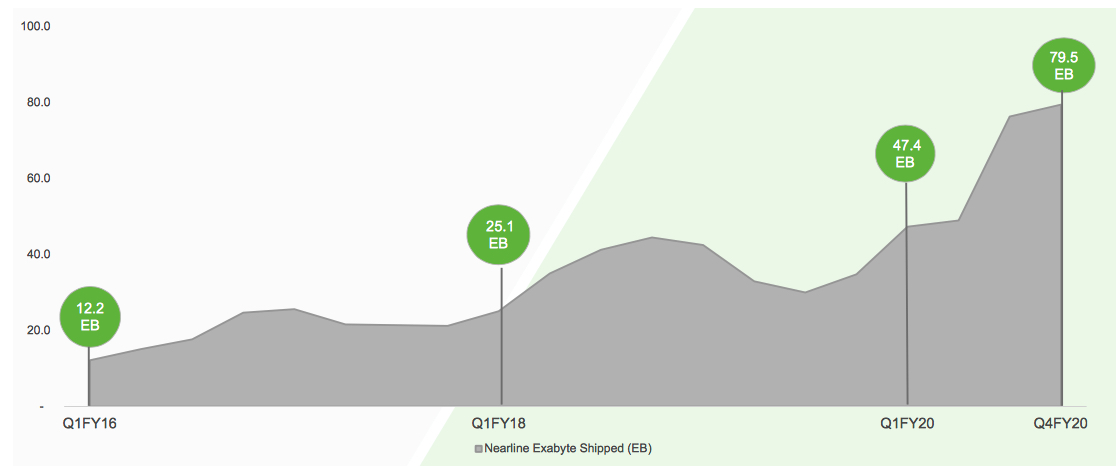
Nearline shipments increased to a record 80EB with average capacity increasing to 10.8TB per drive following strong demand for 16TB drives, which remains the company's highest revenue product in the quarter.
Seagate nearline demand trend
38% CAGR FY16-FY20
Seagate began shipping 18TB HDDs as part of its system solution in the March quarter, with shipments to select cloud customers and channel partners starting in the June quarter. It expects to begin ramping 18TB units within the calendar year.
It remains on track to begin shipping its first commercially available HAMR drives in late 2020 on 20TB capacities. "HAMR technology is a path to achieve later 30, 40, 50TB and even higher," said the company.
Looking ahead to the September quarter, Seagate expects tough demand from the OEM and enterprise markets.
Revenue for video and image application declined for the second consecutive quarter, primarily as a result of the holding health situation.
The legacy markets represented 34% of total June quarter revenue, down from 36% in the March quarter. Exabyte shipments into this market declined 9% sequentially to 26EB. The consumer and PC markets remain relatively soft during the quarter, but a sharper slowdown in enterprise IT spending, particularly among small to medium enterprise customers resulted in weaker than expected demand, for mission critical drives.
The company currently expects enterprise IT spending to remain low over the next couple of quarters, which is also impacting demand recovery for our systems solution. Systems are including in non-HDD business, which represented 8% of total June quarter revenue, up from 7% in the March quarter. In terms of absolute dollars, non-HDD revenue was flat Q/Q as higher demand for enterprise SSD offset the decline in systems.
Revenue by products in $ million
| 3FQ20 | 4FQ20 | Q/Q Growth | % of total revenue in 4FQ20 |
|
| HDDs | 2,526 | 2,321 | -8% | 92% |
| Enterprise data solutions, SSD and others |
192 | 195 | 2% | 8% |
Seagate's HDDs from 2FQ15 to 4FQ20
| Fiscal period | HDD ASP | Exabytes shipped |
Average GB/drive |
| 2Q15 | $61 | 61.3 | 1,077 |
| 3Q15 | $62 | 55.2 | 1,102 |
| 4Q15 | $60 | 52.0 | 1,148 |
| 1Q16 | $58 | 55.6 | 1,176 |
| 2Q16 | $59 | 60.6 | 1,320 |
| 3Q16 | $60 | 55.6 | 1,417 |
| 4Q16 | $67 | 61.7 | 1,674 |
| 1Q17 | $67 | 66.7 | 1,716 |
| 2Q17 | $66 | 68.2 | 1,709 |
| 3Q17 | $67 | 65.5 | 1,800 |
| 4Q17 | $64 | 62.2 | 1,800 |
| 1Q18 | $64 | 70.3 | 1,900 |
| 2Q18 | $68 | 87.5 | 2,200 |
| 3Q18 | $70.5 | 87.4 | 2,400 |
| 4Q18 |
$72 | 92.9 | 2,500 |
| 1Q19 | $70 | 98.8 | 2,500 |
| 2Q19 |
$68 | 87.4 | 2,400 |
| 3Q19 |
$72 | 76.7 | 2,400 |
| 4Q19 | $79.7 | 84.5 | 2,700 |
| 1Q20 |
$81 | 98.3 | 2,900 |
| 2Q20 |
$77 | 106.9 | 3,300 |
| 3F20 | $86 | 120.2 | 4,100 |
| 4F20 |
$89 |
117.0 |
4,500 |


 Subscribe to our free daily newsletter


