


Quantum: Fiscal 4Q20 Financial Results Results
Affected by pandemic, bad outlook with sales down next quarter -16% to -18% Q/Q
This is a Press Release edited by StorageNewsletter.com on June 26, 2020 at 2:26 pm| (in $ million) | 4Q19 | 4Q20 | FY19 | FY20 |
| Revenue | 103.3 | 88.2 | 402.7 | 402.9 |
| Growth | -15% | +0% | ||
| Net income (loss) | (9.4) | (3.8) | (42.8) | (5.2) |
Quantum Corporation announced financial results for its fiscal fourth quarter and year ended March 31, 2020.
FY20 Financial Summary
Revenue was $402.9 million
- Gross margins increased 120 basis points to 42.8%
- Total operating expenses decreased $21.1 million, or 12%
- GAAP net loss narrowed to $5.2 million, or $(0.14) per diluted share
- Adjusted net income increased by $10.6 million to $15.4 million
- Adjusted EBITDA increased by $13.3 million to $45.9 million
“Quantum delivered improved performance in FY20, particularly in terms of profitability, despite a marked slowdown in revenue in mid-March when the outbreak of the Covid-19 pandemic halted professional sporting events and many of our customers in the M&E sectors temporarily ceased filming operations,” commented Jamie Lerner, chairman and CEO. “While the pandemic affected our fourth quarter results and is expected to impact our first fiscal quarter revenue, our efforts over the last year to transform Quantum into a cost-efficient innovator, focused on higher-value and higher-margin solutions, positions us well to emerge from the current environment as a stronger company.”
“Quantum’s technology is relied upon in disaster and crisis situations, and our solutions are core to the BC of many customers, so we remain confident that we are positioned well to weather the delays and disruption we are experiencing,” he continued. “Quantum is also playing a critical role in helping our customers process and manage their video and unstructured data. The short-term impact of the pandemic has not slowed the growth of video. Our pipeline continues to expand and our value proposition remains compelling as we pursue our long-term strategy to provide technology solutions and services to help customers capture, create and share digital content, and preserve and protect it for decades.”
He continued:”We continue to build momentum in our business with hyperscale computing environments, as well as with our healthcare customers, and maintain steady demand from the government and intelligence community, while further establishing our presence in the video surveillance market. The acquisition of the ActiveScale object storage business from Western Digital and the integration of Atavium software into our organization, has strategically bolstered our technology portfolio to strengthen our capabilities in each of these markets. As a result, our position in the industry continues to improve.“
“As we embark on FY21, our success in reducing expenses and streamlining operations enables us to invest in R&D to ensure that we continue to innovate to meet the needs of our customers at every stage of their business life cycles,” he concluded. “In addition, we will continue to focus on strengthening our balance sheet. To that end, we recently amended our term loan and revolving credit agreements to provide us with greater flexibility, reflecting the confidence that our lending partners have in our business and long-term strategy.”
FY20 vs. FY19
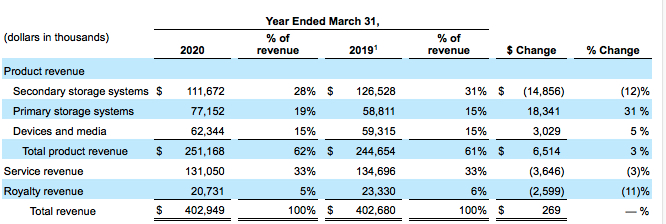
Revenue was $402.9 million for FY20, compared to $402.7 million in FY19. The flat Y/Y performance was driven by a 3% increase in product revenue with growth in primary storage and devices and media partially offset by a decline in secondary storage systems. Strength in products was offset by modest declines in services primarily due to reduced support renewals from legacy backup customers, and royalty driven by overall declines in market unit volumes as the primary use of tape transitions from backup to archive implementations.
Gross profit for FY20 was $172.5 million, or 42.8% gross margin, compared to $167.6 million, or 41.6% gross margin, in FY19. Gross margins improved year over year across a wide range of products, primarily due to reductions in cost of service and a sales mix weighted towards more profitable product lines.
Total operating expenses for FY20 were $151.3 million, or 37.5% of revenue, compared to $172.4 million, or 42.8% of revenue, in FY19. R&D expenses increased 13% to $36.3 million for FY20 compared to $32.1 million inFY19. Selling, general and administrative expenses declined 15% to $114.0 million for FY20 compared to $134.7 million for FY19 due to lower costs associated with the financial restatement and related activities, as well as lower operating expenses overall as a result of our efforts to streamline processes and reduce our facilities footprint.
Net loss was $5.2 million, or $(0.14) per basic and diluted share, compared to a net loss of $(42.8) million, or $(1.20) per basic and diluted share. Excluding non-recurring charges, stock compensation and restructuring charges, Adjusted net income was $15.4 million, or $0.34 per diluted share for FY20, compared to $4.8 million, or $0.12 per diluted share, in fFY19.
Adjusted EBITDA increased $13.3 million to $45.9 million for FY20, compared to $32.5 million in FY19.
4FQ20 vs. 4FQ19
Revenue was $88.2 million for 4FQ20, down 15% compared to $103.3 million in 4FQ19 and in-line with firm’s guidance. The revenue decline was driven by a 20% decrease in product revenue due to reduced demand for secondary storage systems as a result of the Covid-19 pandemic as well as lower hyperscale revenue. Revenue in 4FQ20 includes incremental contribution from the acquisition of the ActiveScale object storage business, which closed on March 17, 2020.
Gross profit in 4FQ20 was $36.1 million, or 40.9% gross margin, compared to $42.7 million, or 41.3% gross margin, in 4FQ19. Gross margins contracted modestly Y/Y primarily due to spreading fixed overhead costs over lower revenue.
Total operating expenses in 4FQ20 were $33.5 million, or 38% of revenue, compared to $43.2 million, or 41.8% of revenue, in 4FQ19. Selling, general and administrative expenses declined 31% to $24.3 million for 4FQ20 compared to $34.9 million in 4FQ19. R&D expenses were $9.2 million in 4FQ20, up 14% compared to $8.1 million in the year ago quarter.
Net loss in 4FQ20 was $3.8 million, or ($0.10) per basic and diluted share, compared to a net loss of $9.4 million, or ($0.26) per basic and diluted share, in 4FQ19.
Excluding non-recurring charges, stock compensation and restructuring charges, Adjusted net loss in 4FQ20 was $2.4 million, or ($0.06) per diluted share, compared to adjusted net income of $2.3 million, or $0.06 per diluted share, in 4FQ19.
Adjusted EBITDA in 4FQ20 2020 decreased $5.7 million to $5.4 million, compared to $11.1 million in 4FQ19.
Balance Sheet and Liquidity
Cash and cash equivalents of $6.4 million as of March 31, 2020, compared to $10.8 million as of March 31, 2019. The current balance excludes $5.0 million in restricted cash required under the company’s credit agreements, and $0.8 million of short-term restricted cash.
Outstanding long-term debt as of March 31, 2020 was $146.8 million net of $13.7 million in unamortized debt issuance costs and $7.3 million in current portion of long-term debt. This compares to $145.6 million of outstanding debt as of March 31, 2019, net of $17.3 million in unamortized debt issuance costs and $1.7 million in current portion of long-term debt. The increase in long-term debt from March 31, 2019 was primarily due to borrowings of $2.6 million at March 31, 2020 from the revolving credit facility to meet short term working capital requirements and paid-in-kind interest of $1.9 million.
Total interest expense was $6.3 million and $25.4 million for the three and twelve months ended March 31, 2020, respectively.
Subsequent to the end of the quarter, on June 16, 2020 the company announced that it had agreed to amend its revolving and term loan credit facilities, securing an additional $20 million in incremental liquidity and negotiating more flexible loan terms and conditions. The facilities, which expire December 27, 2023, can be used to finance working capital and other general corporate purposes. Among other terms, the amended credit facilities provide a holiday period for certain financial covenants through March 31, 2021 and the term loan credit facility contains a more favorable equity claw back feature. The terms of the 2020 term loan credit agreement as amended are substantially similar to the terms of the existing term loan, including in relation to maturity, security and pricing.
Outlook
Due to the continuing uncertainty in the overall economy during the Covid-19 pandemic, the company is not providing full year guidance at this time. However, management expects the customer delays and disruptions experienced in the last 2 weeks of 4FQ20 will have a more pronounced impact on its 1FQ21 revenue.
For 1FQ21, the company expects revenues of $73 million plus or min $1 million. The company expects adjusted net loss to be $8 million plus or min $0.5 million and related adjusted net loss per share of $(0.17) plus or min$0.01. Adjusted EBITDA is expected to be $0 plus or min $1 million.
Comments
FY revenue is flat Y/Y at $402.9 million but far from a record of as much as $1.4 billion 20 years ago, last year being the lowest figure in history of the company.
For the most recent quarter, sales decreased 15% Y/Y and Q/Q at $88.2 milion - including revenue of ActivScale acquisition from WD and despite a late March slowdown driven by Covid-19 - and down from estimation between $96 and $100 million announced at the end of the former quarter - but revised last April -, with loss of 3.8 million vs. net income between $0 and $4 million previously estimated, to be compared to $4.7 million profit 3 months ago.
The company got $130+ million of annual recurring high gross margin revenue from its service businessi nstalled base, and ~$20 million annually from LTO royalties.
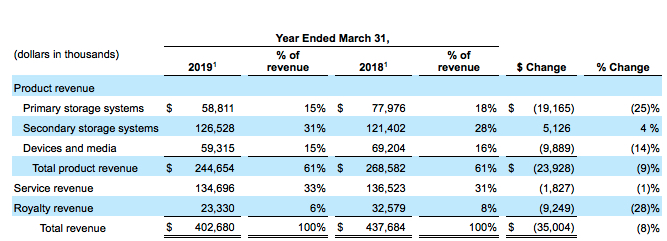
Primary and secondary storage system revenue has been adjusted for FY19 due to certain reclassifications from primary to secondary storage systems.
Product revenue
In FY20, product revenue increased $6.5 million, or 3%, as compared to FY19. Primary storage systems represented $18.3 million of the increase driven by growth across both M&E and government vertical markets. Devices and media increased $3.0 million driven by the resolution of a legal dispute, which had caused a constraint on LTO tape supply between the 2 principal suppliers in the market. This was offset in part by a $14.9 million decrease in secondary storage systems due to declines in legacy enterprise backup business for both branded and OEM products.
Service revenue
In FY20, service revenue decreased $3.6 million, or 3% compared to FY19. This decrease was due to reduced support renewals from legacy backup customers, partially offset by new customer support agreements and installations.
Royalty revenue
Quantum receives royalties from third parties that license its LTO media patents through its membership in the LTO consortium. Royalty revenue decreased $2.6 million, or 11% in FY20 as compared to FY19, related to overall declines in market unit volumes as the primary use of tape transitions from backup to archive workflows.
Fiscal year results ended March 31
| (in $ million) | Revenue | Y/Y Growth | Net income (loss) |
| 1996 |
4,400.0 |
NA | (90) |
| 1998 | 1,189.8 | NA |
170.8 |
| 1999 | 1,302.7 | 9% | (29.5) |
| 2000 | 1,418.9 | 9% | 40.8 |
| 2001 | 1,405.8 | -1% | 160.7 |
| 2002 | 1,087.8 | -23% | 42.5 |
| 2003 | 870.8 | -20% | (264.3) |
| 2004 | 808.3 | -7% | (62.0) |
| 2005 | 794.2 | -2% | (3.5) |
| 2006 | 834.3 | +5% | (41.5) |
| 2007 | 1,016.2 | +22% | (64.1) |
| 2008 | 975.7 | -4% | (60.2) |
| 2009 | 809.0 | -17% | (356.1) |
| 2010 | 681.4 | -16% | 16.6 |
| 2011 | 672.3 | -1% | 4.5 |
| 2012 | 652.4 | -3% | (8.8) |
| 2013 | 587.6 | -10% | (52.4) |
| 2014 | 553.2 | -6% | (21.5) |
| 2015* | 543.7 | -2% | 15.4 |
| 2016* | 479.8 | -12% | (75.6) |
| 2017* | 493.1 | 3% | (2.4) |
| 2018 |
437.7 |
-11% | (43.3) |
| 2019 |
402.7 |
-8% | (42.8) |
| 1FQ20 |
105.6 |
-2% | (3.8) |
| 2FQ20 |
105.8 |
18% | (2.3) |
| 3FQ20 |
103.3 | 1% | 4.7 |
|
4FQ20 |
88.2 |
-15% | (3.8) |
| 2020 |
402.9 |
0% | (5.2) |
* figures as restated


 Subscribe to our free daily newsletter

