


Nutanix: Fiscal 3Q20 Financial Results
$318 million sales up 11% Y/Y but down 8% Q/Q with losses never ending and even growing
This is a Press Release edited by StorageNewsletter.com on May 29, 2020 at 2:05 pm| (in $ million) | 3Q19 | 3Q20 | 9 mo. 19 | 9 mo. 20 |
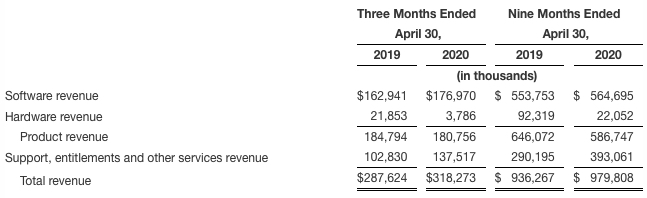
| Revenue | 287.6 | 318.3 | 936.3 | 979.8 |
| Growth | 11% | 5% | ||
| Net income (loss) | (209.8) | (240.7) | (426.8) | (687.5) |
Nutanix, Inc. announced financial results for 3FQ20 ended April 30, 2020.
3FQ20 Highlights
• Revenue: $318.3 million, up 11% from $287.6 million in 3FQ19 (1)
• Billings: $383.5 million, up 11% Y/Y from $346.0 million in 3FQ19 (1)
• Software and Support (TCV) (2) Revenue: $314.5 million, up 18% from $265.8 million in 3FQ19
• Software and Support (TCV) (2) Billings: $379.7 million, up 17% Y/Y from $324.2 million in 3FQ19
• Gross Margin: GAAP gross margin of 77.3%, up from 73.9% in 3FQ19; Non-GAAP gross margin of 80.7%, up from 77.1% in 3FQ19
• Net Loss: GAAP net loss of $240.7 million, compared to a GAAP net loss of $209.8 million in 3FQ19; Non-GAAP net loss of $135.2 million, compared to a non-GAAP net loss of $103.0 million in 3FQ19
• Net Loss Per Share: GAAP net loss per share of $1.23, compared to a GAAP net loss per share of $1.15 in 3FQ19; Non-GAAP net loss per share of $0.69, compared to a non-GAAP net loss per share of $0.56 in 3FQ19
• Cash and Short-term Investments: $732.1 million, down from $940.8 million in 3FQ19
• Deferred Revenue: $1.12 billion, up 34% from 3FQ19
• Operating Cash Flow: Use of $84.9 million, compared to use of $36.5 million in 3FQ19
• Free Cash Flow: Use of $117.5 million, compared to use of $58.9 million in 3FQ19
“We are pleased to have delivered a solid quarter, particularly in light of the global uncertainty caused by the Covid-19 pandemic,” said Dheeraj Pandey, chairman, co-founder and CEO. “We are delighted to be in a position to support our customers with mission-critical solutions as they navigate the rapidly changing landscape of the future of work. Our near-term focus is on thoughtful cash and expense management, while proactively preparing to emerge from this time with the ability to drive long-term growth and scale our business with the market.“
“By adapting quickly to a changing work environment, we were able to meet or exceed our anticipated third quarter results despite the challenging macroeconomic conditions,” said Duston Williams, CFO. “We have also taken proactive measures to manage our operating expenses, which will help meaningfully decrease our cash usage from here and enhance our financial flexibility going forward. While the duration and impact of the pandemic remain uncertain, we are confident that Nutanix is well-positioned to manage the business through this period and will emerge a stronger company with the help of our subscription transition.”
Recent company highlights
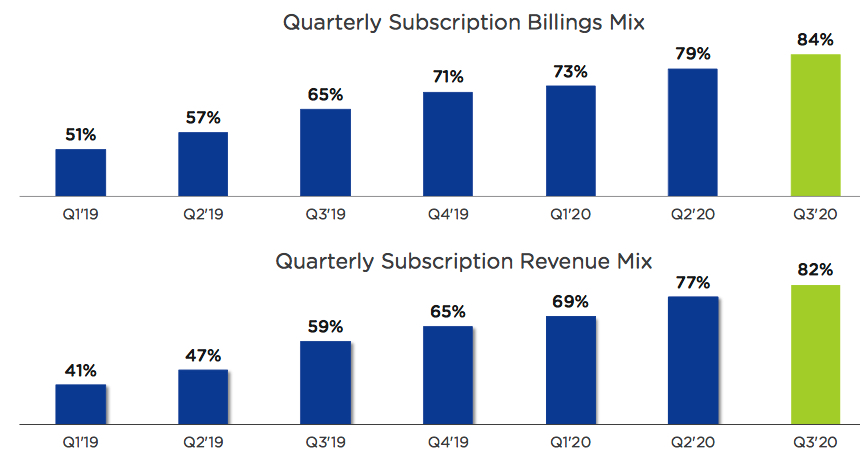
• Reached 84% of Billings from Subscription: It continued its transition to a subscription-based business model, with subscription billings up 43% Y/Y to $321 million, representing 84% of total billings, and subscription revenue up 55% Y/Y to $261 million, representing 82% of total revenue.
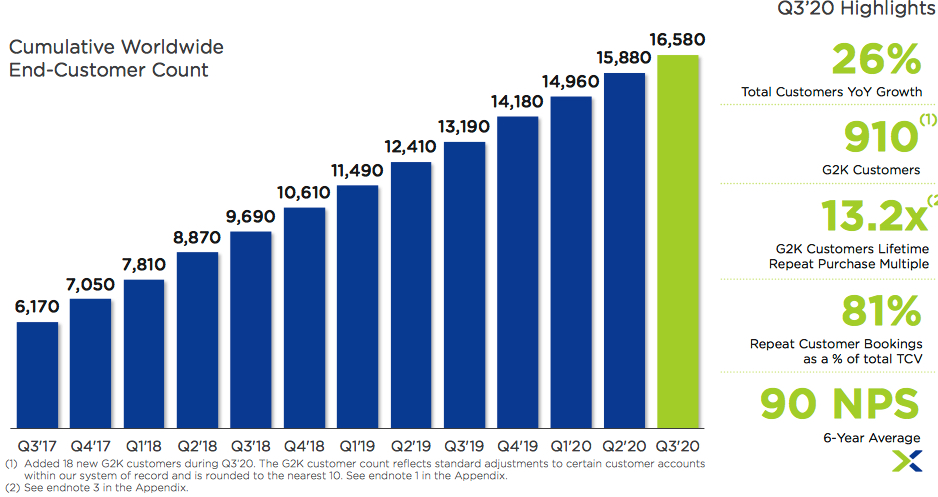
• Expanded Customer Base: It ended 3FQ20 with 16,580 end-customers. Third quarter customer wins included the following Global 2000 companies: Bausch Health Companies, Inchcape, LabCorp, Orient Securities Co..
• Strengthened Board of Directors with Veteran Technology Leader: The company recently appointed industry veteran, Sohaib Abbasi, to its board of directors. The former Informatica CEO and Oracle executive brings technology and leadership experience to the board.
No Financial Outlook
Given the uncertainty created by the Covid-19 pandemic, and as previously announced on May 5, 2020, the company has withdrawn its guidance for FY20, which was originally provided on February 26, 2020, as well as its business model targets for calendar 2021, which were presented during its Investor Day in March 2019. it plans to resume providing formal guidance when visibility improves.
(1) Reflects total billings/revenue compression from the company’s ongoing transition to subscription and the significant reduction of hardware billings/revenue.
(2) TCV or Total Contract Value, for any given period is defined as the total software and support revenue or total software and support billings, as applicable, during such period, which excludes revenue and billings associated with pass-through hardware sales during the period.
Comments
Total revenue of $318 million has returned to double digits Y/Y growth of 11% but is down 8% Q/Q with losses never ending and reaching even $241 million for the most recent quarter.
At the end of the former quarter, the company anticipates that the Y/Y growth rate will accelerate to approximately 10% in 3FQ20, and 25% in 4FQ20.
Last May, Nutanix stated that it expected between $312 and $317 million, up 8% to 10% Y/Y.
CEO Dheeraj Pandey stated: "Since we have spoke during our second quarter earnings call in late February, the way we live has undoubtedly changed. At that time we were just beginning to see the impact of the coronavirus, which was largely isolated to just Asia. As we try to estimate the potential impact of the virus, we provided 3FQ20 guidance that reflected the worsening business conditions in Asia."
Nutanix have implemented 2 non-consecutive single week of unpaid time off for many employees, one week in each of its 4FQ20, FY20 and 1FQ21. Executive team took a 10% reduction in salary starting in April.
Click to enlarge
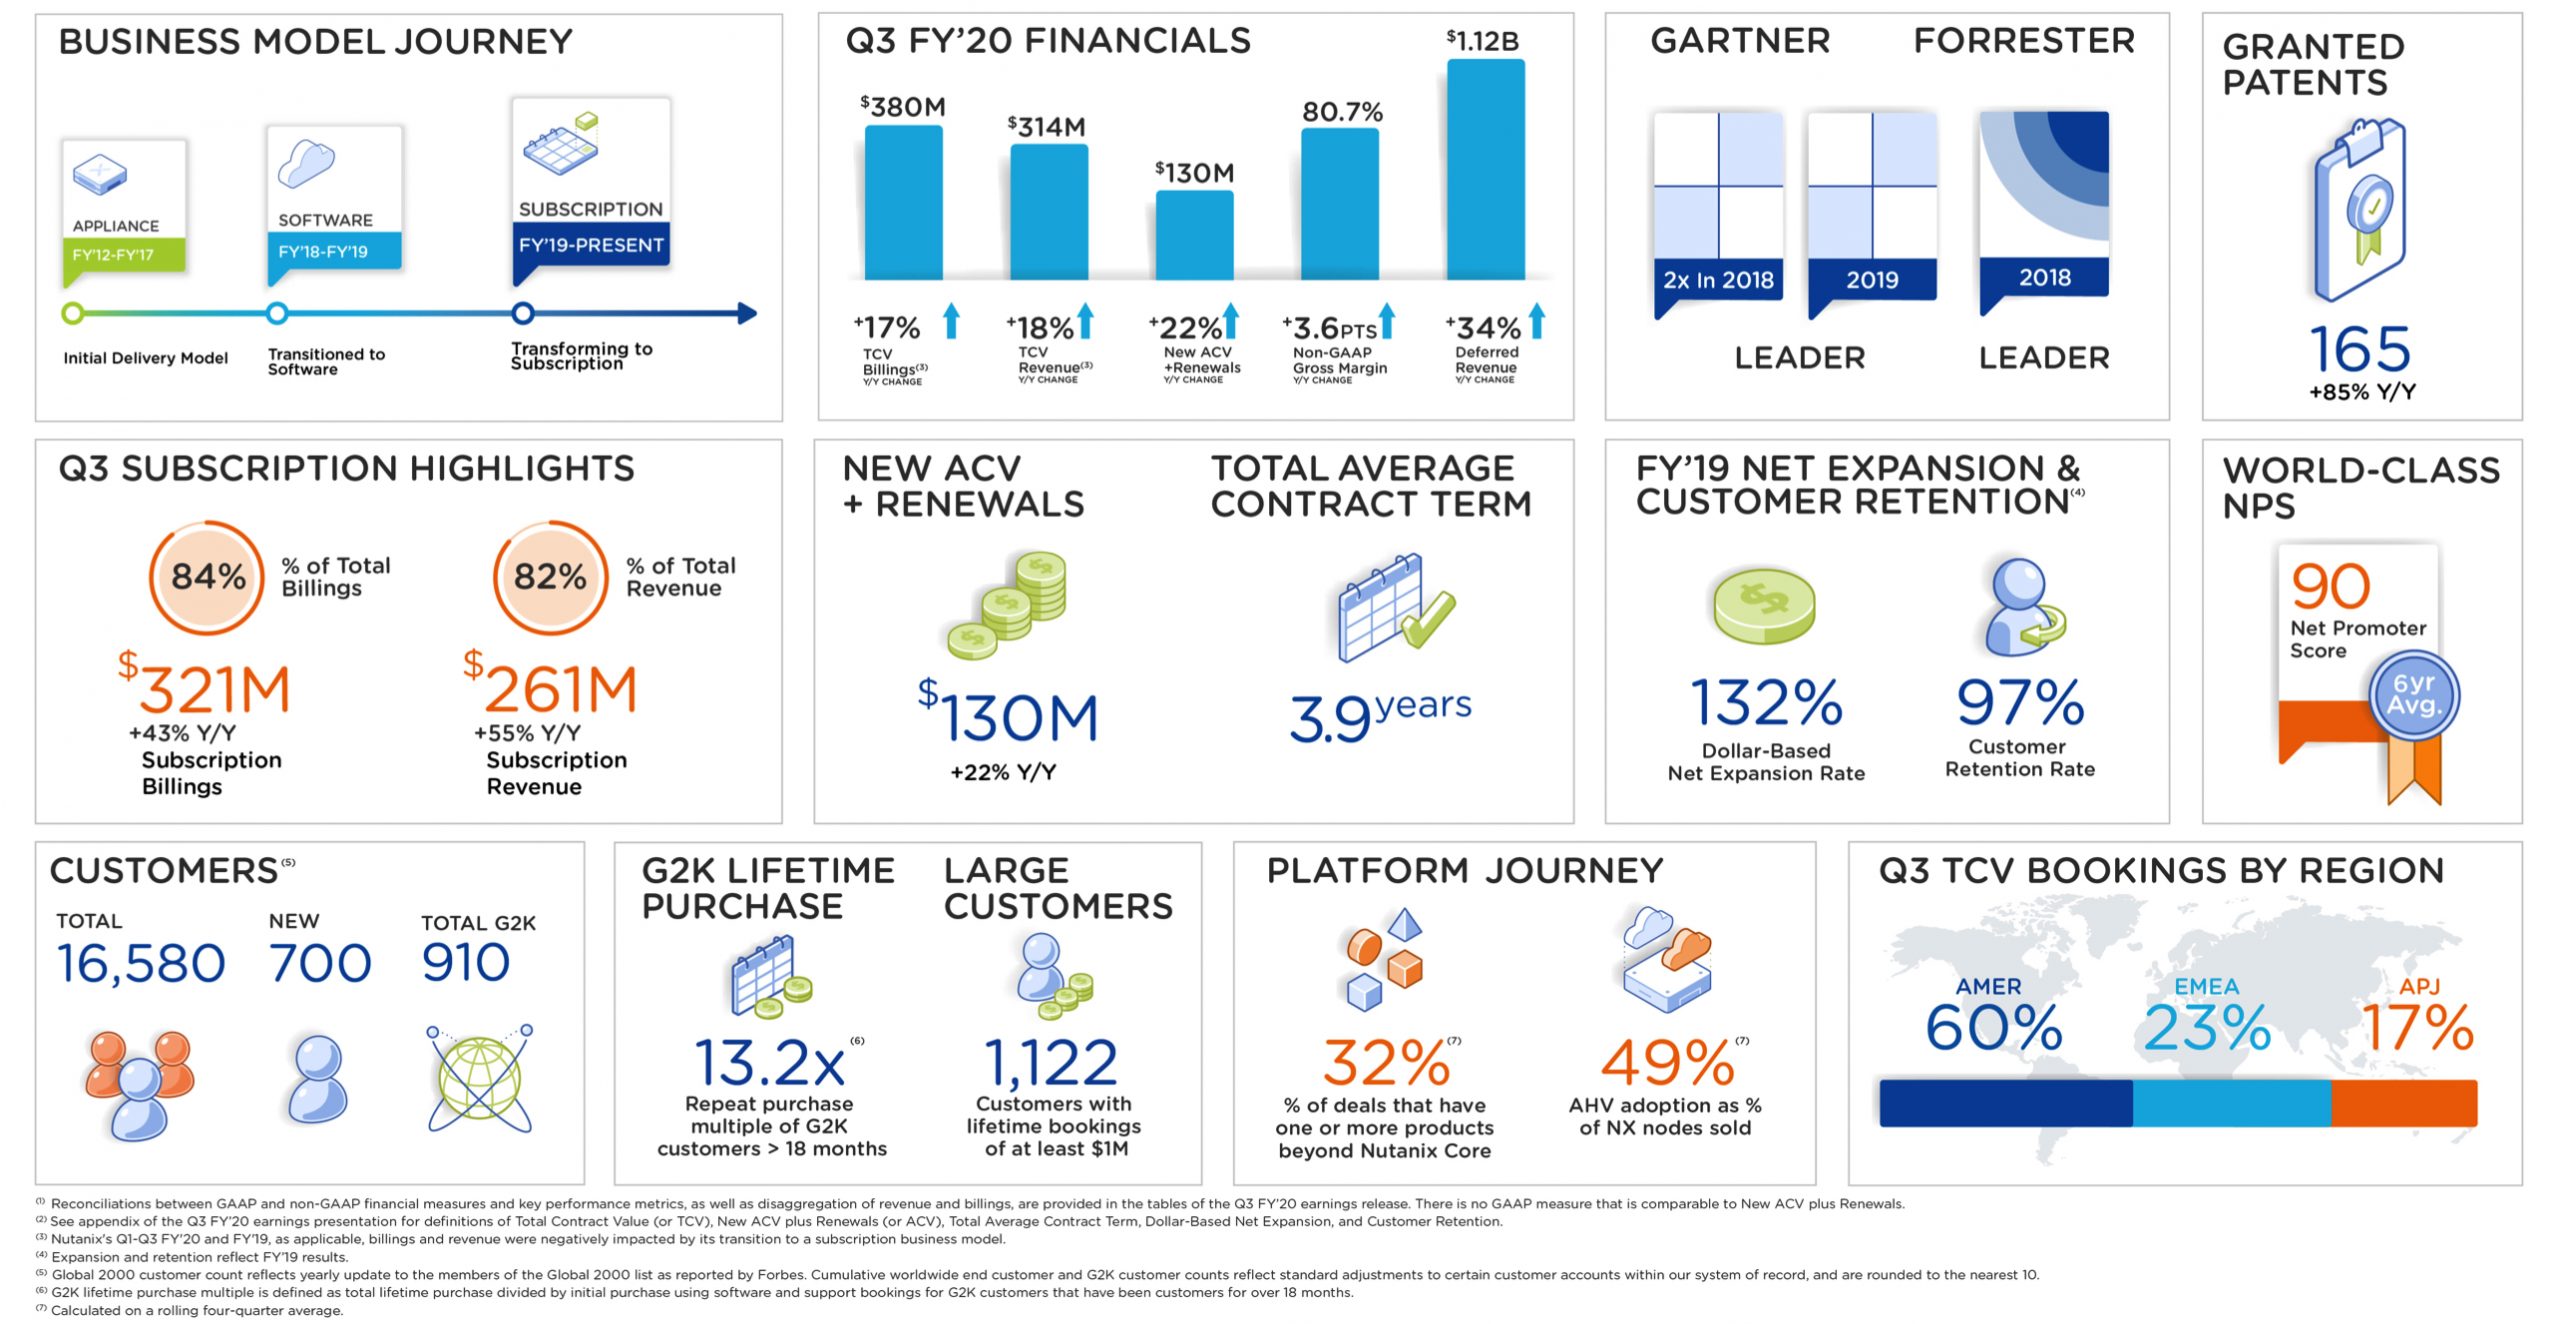
Subscriptions billings now account for 84% of total billings, up from 79% in Q2, and subscription revenue now accounts for 82% of global revenue, up from 77% in Q2. The average dollar weighted term length in 3FQ20 including renewals was 3.9 years, flat with the 3.9 years reported in 2FQ20. As with last quarter, this calculation assumes life of device licenses of five-year terms.
Subscription Transition Progress
As expected, new customer bookings lagged a bit in the quarter, representing 19% of total TCV versus 24% in 3Q19 and down from 24% in 2FQ20.
Customer Growth Momentum (1)
Customers, who have a lifetime spent more than $10 million, have once again grown more than 60% Y/Y, both in number of total accounts and in an aggregate dollars spent. There are 64 customers in this category, and they now account for more than $1.2 billion of lifetime spend. Customers with a minimum lifetime spend of $3 million grew 37% Y/Y to 329 accounts and they have collectively spent more than $2.5 billion in lifetime spend, growing 43% Y/Y.
The number of customers who have spent more than $1 million in lifetime spend has increased to 1,122 up to 32% Y/Y. They grew nearly 40% Y/Y in total lifetime spend.
During the most recent three-month period, Nutanix closed 59 deals worth over $1 million, growing 31% Y/Y in TCV bookings. 11 of these 59 accounts also spend at least $1 million last quarter and the aggregate purchase of notes increased over 40% from last quarter.
The company counts 910 of the Global 2000 as customers and they have collectively spent 37% more in 3FQ20 than 3FQ19. They continue to be 30% of our business.
The firm serves a total of 16,580 customers in over 140 countries.
Its largest deal of this quarter, totaling over $7 million was signed by a large financial services holding company in US for an agile digital infrastructure to build a private cloud.
It has a similar story about a large American financial services company that purchased nearly $5 million of software this quarter, bringing their lifetime spend to over $18 million.
A large automobile manufacturer in US who has spent more than $37 million over the years, purchased another $3.5 million in software in 3FQ20 and switched from life of device to subscription.
Speaking of moment with firm's DDD’s (data center services which includes unified storage, disaster recovery, operations management, networking and security services), in a rolling four quarter basis the attach rate of these products in 3FQ20 was 32%, up from 23% in 3FQ19. On a rolling full quarter basis, the transaction volume of these 3D products in 3FQ20 increased 16% Y/Y and 35% Q/Q. At the end of 3FQ20, 28% of customers have bought at least one of these non-core products, up from 20% in 3FQ19.
3FQ20 lifetime bookings of non-core products grew 116% Y/Y and now make up 13% of new ACV and 15% of overall ACV. The firm saw a good momentum with its DevOps offering, Nutanix Era, its database-as-a-service solution.


 Subscribe to our free daily newsletter

