


NetApp: Fiscal 4Q20 Financial Results
Lowest revenue since FY16, -12% Y/Y and Q/Q
This is a Press Release edited by StorageNewsletter.com on May 28, 2020 at 2:25 pm| (in $ million) | 4Q19 | 4Q20 | FY19 | FY20 |
| Revenue | 1,592 | 1,401 | 6,146 | 5,412 |
| Growth | -12% | -12% | ||
| Net income (loss) | 396 | 196 | 1,169 | 819 |
NetApp, Inc. reported financial results for the fourth quarter and fiscal year 2020, which ended on April 24, 2020.
“During this unprecedented situation, our priority has been supporting our employees, customers, partners, and communities. Despite the challenging environment, we delivered solid gross margin, cash flow and operating leverage in the fourth quarter. Our cloud business grew substantially and our new customer acquisition districts again performed well.” said George Kurian, CEO. “The strength and resiliency of our business model enables us to continue to execute our strategy while navigating a range of potential demand environments. While we cannot predict when the world will return to normal, the enduring importance of data is clear. We are confident that the demand for our products and services will be strong as we emerge from this crisis.”
4FQ20 Financial Results
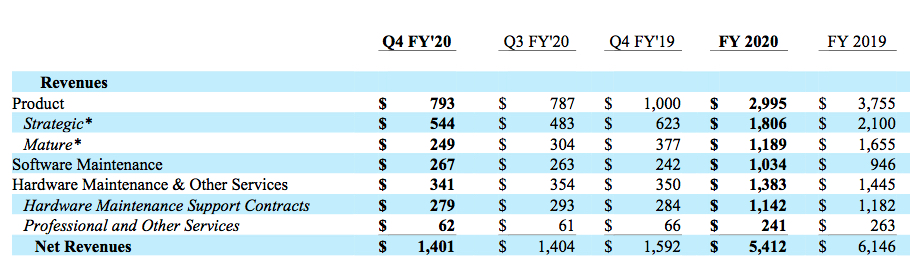
- Net Revenues: $1.40 billion, compared to $1.59 billion in 4FQ19
- Net Income: GAAP net income of $196 million, compared to GAAP net income of $396 million in 4FQ19; non-GAAP net income of $265 million, compared to non-GAAP net income of $305 million in 4FQ19
- Earnings per Share: GAAP net income per share of $0.88 compared to GAAP net income per share of $1.59 in 4FQ19; non-GAAP net income per share of $1.19, compared to non-GAAP net income per share of $1.22 in 4FQ19
- Cash, Cash Equivalents and Investments: $2.88 billion at the end of 4FQ19
- Cash Provided by Operations: $383 million, compared to $399 million in 4FQ19
- Share Repurchase and Dividend: Returned $266 million to shareholders through share repurchases and cash dividends
FY20 Financial Results
- Net Revenues: $5.41 billion, compared to $6.15 billion in FY19
- Net Income: GAAP net income of $819 million, compared to GAAP net income of $1.17 billion in FY19; non-GAAP net income of $944 million, compared to non-GAAP net income of $1.17 billion in FY19
- Earnings per Share: GAAP net income per share of $3.52, compared to GAAP net income per share of $4.51 in FY19; non-GAAP net income per share of $4.05, compared to non-GAAP net income per share of $4.52 in FY19
- Cash Provided by Operations: $1.06 billion compared to $1.34 billion in FY19
- Share Repurchase and Dividend: Returned $1.85 billion to shareholders through share repurchases and cash dividends
Outlook for 1FQ21
Net revenues are expected to be in the range of $1.090 billion to $1.240 billion
Dividend
Next cash dividend of $0.48 per share to be paid on July 29, 2020, to shareholders of record as of the close of business on July 10, 2020.
The company appointed Mike Berry as EVP and CFO, reporting to CEO George Kurian, and added Deepak Ahuja to the board of directors, bringing the number of directors on the board to 8.
Comments
Company continues to shrink drastically. At the end of the former quarter, it expected net revenue to be in the range of $1.455 billion to $1.605 billion for the current quarter, a mid-point decline of 4% Y/Y. Final figures is $1,401 million or -12%.
Per comparison, for their most recent three-month period, storage Y/Y sales of main competitors Dell was -3%, HPE -18%, and +18% for IBM.
For FY20, yearly decline was expected to be approximately 10% Y/Y, it's finally -12%.
On the positive side, NetApp continues to be slightly profitable and generated roughly $1 billion of free cash flow last year. It delivered strong gross margin, cash flow and operating leverage in 4FQ20, despite the challenging environment.
In April, the pace of business slowed significantly. The company saw delays in some large deals, while at the same time some companies accelerated orders to get ahead of shutdown and others initiated new transactions to address the demands of remote working and digital business.
Based on the last month of 4FQ20, annualized recurring revenue for cloud data services increased to $111 million.
All-flash revenue of $656 million was down 3% Y/Y. But the firm continues to believe that there is a very healthy runway for all-flash adoption, as only 24% of its installed systems are all-flash.
Cloud data services delivered $111 million in ARR, growing 113% Y/Y and 34% sequentially. Cloud data services customer count now exceeds 3,500, more than doubling from 4FQ19.
Total product revenue was $793 million for 4FQ20 decreasing 21% Y/Y.
Software maintenance and hardware maintenance revenue of $546 million, was up 4% Y/Y. These two recurring revenue lines comprise 40% of total net revenue.
During the quarter, the firm achieved its target of adding 200 primary sales headcount three months ahead of schedule.
Entering FY21, NetApp created a separate globally integrated structure for its cloud data services sales teams, with the sole focus of scaling its cloud services business by maximizing its partnerships with the biggest public clouds and helping customers and partners accelerate their public cloud journey.
Next quarter, expectation is from $1,090 to $1,240 for sales, or down 12% to 0%, respectively, the lower figure since a long time.
George Kurian, president and CEO, stated: "As we enter into FY21, we will continue to manage the business efficiently, while focusing on two clear priorities: returning to growth, with share gains in our storage business, powered by our industry-leading file block and object software and scaling our highly differentiated cloud data services business. We will exploit competitive transitions and the accelerating shift to cloud to expand the usage of our products and services."
| Fiscal Period | Revenue | Y/Y Growth | Net income (loss) |
| FY16 | 5,546 | -9% | 229 |
| FY17 | 5,519 | -0% | 509 |
| 1Q18 | 1,325 | -11% | 136 |
| 2Q18 | 1,422 | 7% | 175 |
| 3Q18 | 1,523 | 7% | (506) |
| 4Q18 | 1,641 | 8% | 271 |
| FY18 | 5,911 | 7% | 75 |
| 1Q19 |
1,474 | 12% |
283 |
| 2Q19 |
1,517 | 7% |
241 |
| 3Q19 |
1,563 | 2% |
319 |
| 4Q19 |
1,592 | -3% |
296 |
| FY19 |
6,146 | 4% |
1,169 |
| 1Q20 |
1,236 | -16% | 103 |
| 2Q20 |
1,371 | -10% | 243 |
| 3Q20 |
1,404 | -10% | 277 |
| 4Q20 |
1,401 | -12% | 196 |
| FY20 |
5,412 | -12% |
819 |
| 1Q21* |
1,090-1,240 |
-12%/-0% |
NA |
Revenue and net income (loss) in $ million
* Outlook
To read the earnings call transcript


 Subscribe to our free daily newsletter


