









Quantum: Fiscal 3Q20 Financial Results
Back on Nasdaq on February 3, 2020, and to small growth and profitability, but bad outlook for next quarter
This is a Press Release edited by StorageNewsletter.com on January 31, 2020 at 2:24 pm| (in $ million) | 3Q19 | 3Q20 | 9 mo. 19 | 9 mo. 20 |
| Revenue | 102.0 | 103.3 | 299.4 | 314.7 |
| Growth | 1% | 5% | ||
| Net income (loss) | (4.3) | 4.7 | (33.4) | (1.4) |
Quantum Corporation announced financial results for its 3FQ20 ended December 31, 2019.
Nasdaq Listing
Quantum has received approval to list the company’s common stock on the Nasdaq Global Market. Management expects shares of the company’s common stock will begin trading on The Nasdaq Stock Market on Monday, February 3, 2020 under the ticker QMCO.
Highlights: 3FQ20 vs. 3FQ19
• Gross margins increased 340 basis points to 45.6%
• Net income increased by $9.0 million to $4.7 million
• Adjusted net income increased by $3.9 million to $7.3 million
• Adjusted EBITDA increased by $3.6 million to $14.7 million
• Revenue increased 1% to $103.3 million
• R&D investments increased 18%
Jamie Lerner, chairman and CEO, commented: “We continued to advance our strategic transformation, focusing on margin expansion and profitability as we reposition Quantum as an innovator, poised to solve the biggest challenges around video and video-like data.“
The 3FQ20 gross margin of 45.6% reflected a favorable sales mix and focus on a value-selling approach.
Excluding the contribution from royalty revenue, the company’s gross margin reached 43.4%, compared to 39.3% in 3FQ19, demonstrating the increased value it is providing to customers. This translated to an improvement in operating margin and a return to GAAP profitability, with $4.7 million in net income, compared to a net loss of $4.3 million in 3FQ19. Year-to-date, gross margin was 43.3% compared to 41.7%, an improvement of 160 basis points.
“This return to profitability validates the success of our transformation and provides us momentum as we uplist to the Nasdaq,” Lerner continued.
Quantum achieved its profitability guidance for the quarter, despite generating revenues that were lower than expectations, primarily as a result of the volatility inherent to its hyperscaler business, where timing of large orders can fluctuate based on a variety of external factors.
“Our 3FQ20 results demonstrate that with an improved sales mix, continued operational efficiency and sales discipline, we can drive incremental profitability even across slightly lower revenue,” Lerner added. “The long-term business opportunity in the archive tape storage market remains significant, so while we expect our hyperscale business in the short term to continue to be volatile, longer term we anticipate adding new hyperscale customers, which will help address non-linear purchasing patterns from a concentrated customer base. As a result, we have made the prudent decision to adjust our full year guidance. This decision underscores the short-term volatility related to larger customers who are looking to leverage the reliability and value tape offers, giving us increased optimism in the opportunity as we work to accelerate top-line growth in FY21 and beyond.“
“Our offerings in the video and video-like data portion of our business remained strong, and we continue to see growing demand for our differentiated solutions,” he concluded. “Our focus is to increase the contribution from these products, which maintain a better margin profile, which should mitigate the timing of hyperscale revenue over time. Our new F-Series solutions had their strongest quarter yet and I am encouraged with the momentum for these products, and this reinforces my confidence in sustainable, profitable growth.”
3FQ20 vs. 3FQ19
- Revenue was $103.3 million for 3FQ20, up 1% compared to $102.0 million in the year ago quarter.
- Gross profit in 3FQ20 was $47.1 million or 45.6% gross margin, compared to $43.1 million, or 42.2% gross margin in 3FQ19. Gross margins improved Y/Y primarily due to a sales mix weighted towards more profitable product lines and service offerings as well as cost reductions across a range of products.
- Total operating expenses were $35.4 million, or 34.3% of revenue in 2FQ20, compared to $39.6 million, or 38.8% of revenue in 3FQ19. Selling, general and administrative expenses declined 15% to $26.1 million compared to $30.5million in the year ago quarter. R&D expenses were $9.3 million, up 18% compared to $7.9 million in the year ago quarter.
- Net income was $4.7 million, or $0.10 per diluted share in 3FQ20, compared to a net loss of $(4.3) million, or $(0.12) per share, in 3FQ19.
- Excluding non-recurring charges, stock compensation and restructuring charges, adjusted net income was $7.3 million, or $0.16 per diluted share 3FQ20, compared to $3.4 million, or $0.08 per diluted share in 3FQ19.
- Adjusted EBITDA increased $3.6 million to $14.7 million in 3FQ20, compared to $11.1 million in the 3FQ19.
Year-to-Date FY20 vs. Year-to-Date FY19
- Revenue was $314.7 million and increased 5% for the first 9 months of FY20, compared to $299.4 million in the year-ago period. The growth was driven by a 10% increase in product revenue with growth across all product lines, which was partially offset by declines in royalty and service revenues. The modest decline in service revenues was primarily due to the timing of customer installation scheduling.
- Gross profit for the first 9 months of FY20 was $136.4 million, or 43.3% gross margin, compared to $124.9 million, or 41.7% gross margin, in the year ago period. Gross margins improved Y/Y primarily due to cost reductions in cost of service and across a range of products and a sales mix weighted towards more profitable product lines.
- Total operating expenses for the first 9 months of fiscal 2020 were $117.8 million, or 37% of revenue, compared to $129.2 million, or 43% of revenue, in the year ago period. R&D expenses increased 13% to $27.1 million for the first nine months of FY20 compared to $24.0 million in the year ago period. Selling, general and administrative expenses declined 10% to $89.7 million for the first nine months of FY20 compared to $99.7 million for the year ago period due to lower costs associated with the financial restatement and related activities and overall lower operating expenses as a result of our efforts to streamline processes and tools and reduce our facilities footprint.
- Net loss was $1.4 million, or $(0.04) per share, for the first 9 months of fiscal 2020, compared to a net loss of $(33.4) million, or $(0.94) per share, in the year ago quarter.
- Excluding non-recurring charges, stock compensation and restructuring charges, adjusted net income was $17.8 million, or $0.40 per diluted share for the first 9 months of fiscal 2020, compared to $1.9 million, or $0.05 per diluted share, in the same period last year.
- Adjusted EBITDA increased $15.9 million to $40.5 million for the first nine months of fiscal 2020, compared to $20.7 million in the year ago period.
Balance Sheet and Liquidity as of December 31, 2019
- Cash and cash equivalents of $7.5 million as of December 31, 2019, compared to $10.8 million as of March 31, 2019. These amounts exclude $5.9 million in restricted cash required under the company’s credit agreements.
- Outstanding long-term debt as of December 31, 2019 was $152.4 million net of $14.6 million in unamortized debt issuance costs and $1.7 million in current portion of long-term debt. This compares to $145.6 million of outstanding debt as of March 31, 2019, net of $17.3 million in unamortized debt issuance costs and $1.7 million in current portion of long-term debt. The increase in long term debt from March 31, 2019 was primarily due to borrowings of $5.3 million at December 31, 2019 from the revolving credit facility to meet short term working capital requirements.
- Total interest expense was $6.4 million and $19.1 million for the 3 and 9 months ended December 31, 2019, respectively.
Outlook
The company noted that 4FQ20, excluding the impact of hyperscale business, has historically been the lowest product revenue period of the year. For this quarter of 2020, it expects revenues of $95 million plus or minus $5 million, adjusted net income to be $2 million plus or minus $2 million, and related adjusted net income per share of $0.04 plus or minus $0.04. Adjusted EBITDA is expected to be $10 million plus or minus $2 million.
Quantum is adjusting its full-year outlook. Management now expects total revenues for FY20 to be $410 million plus or minus $5 million and adjusted EBITDA guidance to be $50 million plus or minus $2 million.
Settlement of SEC Investigation
The company and the SEC have settled a cease-and-desist proceeding arising out of the SEC’s investigation of the matters disclosed in the company’s current reports on Form 8-K filed on February 8, 2018, September 14, 2018 and August 6, 2019. The matters concern the company’s historic accounting practices, internal controls and a restatement related to revenue recognition for transactions between 4FQ15 and 2FQ18. The settlement includes a cease and desist order and payment of $1.0 million as a civil penalty; the order may be viewed on the SEC’s website.
Comments
FY revenue are flat Y/Y at $402.9 million but far from a record of as much as $1.4 billion 20 years ago.
For the most recent quarter, sales decreased 15% Y/Y and Q/Q at $88.2 milion - including revenue of ActivScale acquisition from WD and despite a late March slowdown driven by Covid-19 - and down from estimation between $96 and $100 million announced at the end of the former quarter - but revised last April -, with loss of 3.8 million vs. net income between $0 and $4 million previously estimated, to be compared to $4.7 million profit 3 months ago.
The company got $130+ million of annual recurring high gross margin revenue from its service businessi nstalled base, and ~$20 million annually from LTO royalties.
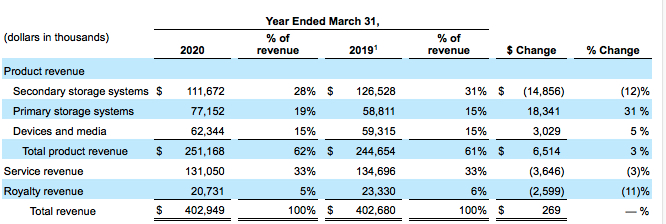
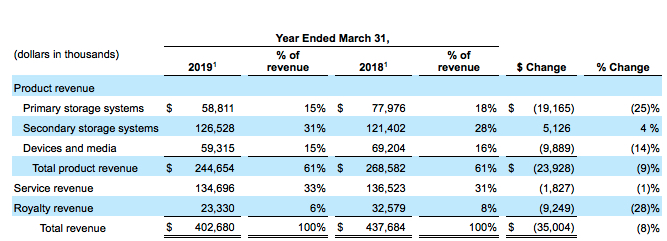
1 Primary and secondary storage system revenue has been adjusted for FY19 due to certain reclassifications from primary to secondary storage systems.
Product Revenue
In FY20, product revenue increased $6.5 million, or 3%, as compared to FY19. Primary storage systems represented $18.3 million of the increase driven by growth across both M&E and government vertical markets. Devices and media increased $3.0 million driven by the resolution of a legal dispute, which had caused a constraint on LTO tape supply between the 2 principal suppliers in the market. This was offset in part by a $14.9 million decrease in secondary storage systems due to declines in legacy enterprise backup business for both branded and OEM products.
Service Revenue
In FY20, service revenue decreased $3.6 million, or 3% compared to FY19. This decrease was due to reduced support renewals from legacy backup customers, partially offset by new customer support agreements and installations.
Royalty Revenue
Quantum receives royalties from third parties that license its LTO media patents through its membership in the LTO consortium. Royalty revenue decreased $2.6 million, or 11% in FY20 as compared to FY19, related to overall declines in market unit volumes as the primary use of tape transitions from backup to archive workflows.
Fiscal year results ended March 31
| (in $ million) | Revenue | Y/Y Growth | Net income (loss) |
| 1998 | 1,189.8 | NA |
170.8 |
| 1999 | 1,302.7 | 9% | (29.5) |
| 2000 | 1,418.9 | 9% | 40.8 |
| 2001 | 1,405.8 | -1% | 160.7 |
| 2002 | 1,087.8 | -23% | 42.5 |
| 2003 | 870.8 | -20% | (264.3) |
| 2004 | 808.3 | -7% | (62.0) |
| 2005 | 794.2 | -2% | (3.5) |
| 2006 | 834.3 | +5% | (41.5) |
| 2007 | 1,016.2 | +22% | (64.1) |
| 2008 | 975.7 | -4% | (60.2) |
| 2009 | 809.0 | -17% | (356.1) |
| 2010 | 681.4 | -16% | 16.6 |
| 2011 | 672.3 | -1% | 4.5 |
| 2012 | 652.4 | -3% | (8.8) |
| 2013 | 587.6 | -10% | (52.4) |
| 2014 | 553.2 | -6% | (21.5) |
| 2015* | 543.7 | -2% | 15.4 |
| 2016* | 479.8 | -12% | (75.6) |
| 2017* | 493.1 | 3% | (2.4) |
| 2018 |
437.7 |
-11% | (43.3) |
| 2019 |
402.7 |
-8% | (42.8) |
| 1FQ20 |
105.6 |
-2% | (3.8) |
| 2FQ20 |
105.8 |
18% | (2.3) |
| 3FQ20 |
103.3 | 1% | 4.7 |
|
4FQ20 |
90-100 |
NA | 0-4 |
| 2020 (estimation) |
405-415 |
1-3% | NA |
* figures as restated








 Subscribe to our free daily newsletter