


Lifetime HDD Failure Rates Rose From 1.70% in 2Q19 to 1.73% in 3Q19
Based on 115,151 spinning drives used in Backblaze data centers
This is a Press Release edited by StorageNewsletter.com on November 18, 2019 at 2:17 pm This article was written on September, 2019 by Andy Klein, director of product marketing, on a blog of Backblaze, Inc.
Backblaze HDD Stats 3Q19
As of September 30, 2019, Backblaze had 115,151 spinning HDDs spread across 4 data centers on two continents. Of that number, there were 2,098 boot drives and 113,053 data drives.
We’ll look at the lifetime HDD failure rates of the data drive models currently in operation in our data centers, but first we’ll cover the events that occurred in 3Q19 that potentially affected the drive stats for that period. As always, we’ll publish the data we use in these reports on our HDD Test Data web page and we look forward to your comments.
HDD Stats for 3Q19
At this point in prior HDD stats reports we would reveal the quarterly HDD stats table. This time we are only going to present the Lifetime HDD Failure table. For the 3Q19 table, the data which we typically use to create that report may have been indirectly affected by one of our utility programs which performs data integrity checks. While we don’t believe the long-term data is impacted, we felt you should know. Below, we will dig into the particulars in an attempt to explain what happened in 3Q19 and what we think it all means.
What Is Drive Failure?
Over the years we have stated that a drive failure occurs when a drive stops spinning, won’t stay as a member of a RAID array, or demonstrates continuous degradation over time as informed by SMART stats and other system checks. For example, a drive that reports a rapidly increasing or egregious number of media read errors is a candidate for being replaced as a failed drive. These types of errors are usually seen in the SMART stats we record as non-zero values for SMART 197 and 198 which log the discovery and correctability of bad disk sectors, typically due to media errors. We monitor other SMART stats as well, but 2 two are the most relevant to this discussion.
What might not be obvious is that changes in some SMART attributes only occur when specific actions occur. Using SMART 197 and 198 as examples again, these values are only affected when a read or write operation occurs on a disk sector whose media is damaged or otherwise won’t allow the operation. In short, SMART stats 197 and 198 that have a value of zero today will not change unless a bad sector is encountered during normal disk operations. These two SMART stats don’t cause read and writes to occur, they only log aberrant behavior from those operations.
Protecting Stored Data
When a file, or group of files, arrives at a Backblaze data center, the file is divided into pieces we call shards. For more information on how shards are created and used in the Backblaze architecture, please refer to Backblaze Vaulthttps://www.backblaze.com/blog/vault-cloud-storage-architecture/ and Backblaze Erasure Coding blog posts. For simplicity’s sake, let’s say a shard is a blob of data that resides on a disk in our system.
As each shard is stored on a HDD, we create and store a one-way hash of the contents. For reasons ranging from media damage to bit rot to gamma rays, we check the integrity of these shards regularly by recomputing the hash and comparing it to the stored value. To recompute the shard hash value, a utility known as a shard integrity check reads the data in the shard. If there is an inconsistency between the newly computed and the stored hash values, we rebuild the shard using the other shards as described in the Backblaze Vault blog post.
Shard Integrity Checks
The shard integrity check utility runs as a utility task on each Storage Pod. In late June, we decided to increase the rate of the shard integrity checks across the data farm to cause the checks to run as often as possible on a given drive while still maintaining the drive’s performance. We increased the frequency of the shard integrity checks to account for the growing number of larger-capacity drives that had been deployed recently.
Consequences for Drive Stats
Once we write data to a disk, that section of disk remains untouched until the data is read by the user, the data is read by the shard integrity check process to recompute the hash, or the data is deleted and written over. As a consequence, there are no updates regarding that section of disk sent to SMART stats until one of those three actions occur. By speeding up the frequency of the shard integrity checks on a disk, the disk is read more often. Errors discovered during the read operation of the shard integrity check utility are captured by the appropriate SMART attributes. Putting together the pieces, a problem that would have been discovered in the future-under our previous shard integrity check cadence-would now be captured by the SMART stats when the process reads that section of disk today.
By increasing the shard integrity check rate, we potentially moved failures that were going to be found in the future into 3Q19. While discovering potential problems earlier is a good thing, it is possible that the HDD failures recorded in 3Q19 could then be artificially high as future failures were dragged forward into the quarter. Given that our Annualized Failure Rate calculation is based on Drive Days and Drive Failures, potentially moving up some number of failures into Q3 could cause an artificial spike in the 3Q19 Annualized Failure Rates. This is what we will be monitoring over the coming quarters.
There are a couple of things to note as we consider the effect
of the accelerated shard integrity checks on the 3Q19 data for Drive Stats:
• The number of drive failures over the lifetime of a given drive model should not increase. At best we just moved the failures around a bit.
• It is possible that the shard integrity checks did nothing to increase the number of drive failures that occurred in 3Q19. The quarterly failure rates didn’t vary wildly from previous quarters, but we didn’t feel comfortable publishing them at this time given the discussion above.
Lifetime HDD Stats Through 3Q19
Below are the lifetime failure rates for all of our drive models in service as of September 30, 2019.
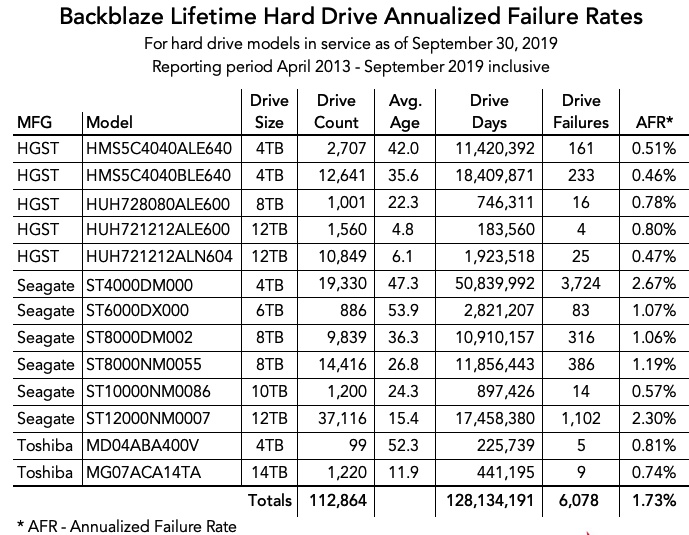
The lifetime failure rate for the drive models in production rose slightly, from 1.70% at the end of 2Q19 to 1.73% at the end of 3Q19. This trivial increase would seem to indicate that the effect of the potential 3Q19 data issue noted above is minimal and well within a normal variation. However, we’re not satisfied that is true yet and we have a plan for making sure as we’ll see in the next section.
What’s Next for Drive Stats?
We will continue to publish our HDD Stats each quarter, and next quarter we expect to include the quarterly (4Q19) chart as well. For the foreseeable future, we will have a little extra work to do internally as we will be tracking two different groups of drives. One group will be the drives that “went through the wormhole,” so to speak, as they were present during the accelerated shard integrity checks. The other group will be those drives that were placed into production after the shard integrity check setting was reduced. We’ll compare these two datasets to see if there was indeed any effect of the increased shard integrity checks on the 3Q19 HDD failure rates. We’ll let you know what we find in subsequent drive stats reports.
HDD Stats Data
The complete data set used to create the information used in this review is available on our HDD Test Data web page.


 Subscribe to our free daily newsletter

