


Quantum: Fiscal 2Q20 Financial Results
For FY20, lowest revenue expected since more than 20 years but in FY19!
This is a Press Release edited by StorageNewsletter.com on November 7, 2019 at 2:26 pm| (in $ million) | 2Q19 | 2Q20 | 6 mo. 19 | 6 mo. 20 |
| Revenue | 89.9 | 105.8 | 197.4 | 211.4 |
| Growth | 18% | 7% | ||
| Net income (loss) | (21,6) | (2,3) | (29,1) | (6,1) |
Quantum Corporation announced financial results for its second fiscal quarter ended September 30, 2019.
“Our strategic transformation accelerated in the second quarter as we reported double-digit revenue growth, margin expansion, and excluding non-recurring items, continued reductions in operating expenses, all of which led to continued profitability,” commented Jamie Lerner, chairman and CEO. “Our continued expense discipline more than offset an incremental investment in R&D, supporting recently released products and our pipeline of future offerings. We are well-positioned as a recognized industry leader in the storage and management of video and video-like data, and this accelerating trend should support future profitable growth for Quantum.”
2FQ20 vs. 1FQ20
- Revenue was $105.8 million, up 18% compared to $89.9 million in 1FQ20.
- Gross profit was $43.5 million or 41.1% gross margin, compared to $35.5 million, or 39.5% gross margin, in 1FQ20. Gross margins improved Y/Y primarily due to cost reductions across a range of products and a sales mix weighted towards more profitable product lines.
- Total operating expenses were $39.3 million, or 37% of revenue compared to $38.9 million, or 43% of revenue, in 2FQ19. Selling, general and administrative expenses declined 5% to $29.2 million compared to $30.8 million in 2FQ19. R&D expenses were $9.4 million, up 19% compared to $7.9 million in 2FQ19.
- Excluding non-recurring charges, stock compensation and restructuring charges, adjusted net income was $5.1 million, or $0.11 per diluted share, compared to an adjusted net loss of ($5.6) million, or $(0.16) per diluted share, in 2FQ19.
- Adjusted EBITDA increased $10.3 million to $12.7 million compared to $2.4 million in 2FQ19.
FY20 vs. FY19
- Revenue was $211.4 million and increased 7% for the first six months of FY20, compared to $197.4 million in the year-ago period.
- Gross profit for the first six months of fiscal 2020 was $89.3 million, or 42.3% gross margin, compared to $81.9 million, or 41.5% gross margin, in the year ago period. Gross margins improved Y/Y primarily due to cost reductions across a range of products and a sales mix weighted towards more profitable product lines.
- Total operating expenses for the first six months of fiscal 2020 were $82.4 million, or 39% of revenue, compared to $89.6 million, or 45% of revenue, in the year ago period. Selling, general and administrative expenses declined 8% to $63.6 million for the first six months of fiscal 2020 compared to $69.3 million for the year ago period. R&D expenses were $17.7 million for the first six months of fiscal 2020, up 10% compared to $16.1 million in the year ago period.
- Excluding non-recurring charges, stock compensation and restructuring charges, adjusted net income was $10.5 million, or $0.24 per diluted share for the first six months of fiscal 2020, compared to an adjusted net loss of ($3.3) million, or $(0.09) per diluted share, in the same period last year.
- Adjusted EBITDA increased $16.2 million to $25.8 million for the first six months of fiscal 2020, compared to $9.6 million in the year ago period.
Balance sheet and liquidity as of September 30, 2019
- Cash and cash equivalents of $6.0 million as of September 30, 2019, compared to $10.8 million as of March 31, 2019. These amounts exclude $5.0 million in restricted cash required under the company’s credit agreements.
- Outstanding long-term debt as of September 30, 2019 was $153.6 million net of $15.5 million in unamortized debt issuance costs and $1.7 million in current portion of long-term debt. This compares to $145.6 million of outstanding debt as of March 31, 2019, net of $17.3 million in unamortized debt issuance costs and $1.7 million in current portion of long-term debt. The increase in long term debt from March 31, 2019 was primarily due to borrowings of $7.0 million at September 30, 2019 from the revolving credit facility to meet short term working capital requirements.
- Total interest expense for 2FQ20 was $6.3 million.
Outlook
- The 3FQ20 that ends in December is traditionally the company’s strongest of the fiscal year and management expects revenues in the range of $106 million to $112 million. Excluding approximately $2 million of stock-based compensation charges, the company expects resulting adjusted net income to be in the range of $6 million to $8 million and related diluted adjusted net income per share of $0.13 to $0.18. Adjusted EBITDA is expected to be in the range of $13 million to $15 million.
- For FY20, total revenues are expected in the range of $424 million to $430 million and adjusted EBITDA to be in a range of $51 million to $55 million.
Change in board of directors
The company also announced that Eric Singer has decided to retire from the board effective as of November 3, 2019. He had served as an independent director since 2017, and had served as chairman of Quantum’s leadership and compensation committee and as a member of the corporate governance and nominating committee.
“We are extremely appreciative of Eric’s leadership on Quantum’s board,” said Lerner. “Eric, as a representative of our largest stockholder at that time, VIEX Capital Advisors, began a campaign to replace the Board and change the management of Quantum in early 2016. He was appointed to our board in 2017.”
He continued: “Simply put, we would not be in the position we are today without Eric’s steadfast commitment to and leadership in Quantum’s turnaround. He was the catalyst of change that led to a complete turnover in management and the board, improved operating performance and the implementation of strong corporate governance practices at Quantum. We thank him for his active involvement and tireless dedication in restoring Quantum and helping position us for the future.”
Comments
Company is slowly recovering as it concentrated since several quarters on the storage and management of video and video-like data.
For the current quarter, revenue at $106 million is stable Q/Q and up 18% Y/Y, a little more than what was expected ($99 to $105 million), decreasing 2% sequentially for the former three-month period.
Outlook is $106 million to $112 million (+0% to +6%) for 3FQ20, and $424 million to $430 million (+5% to +7%) for FY20, the lowest figures since at least 20 years ago but in FY19 ($402.7 million)!
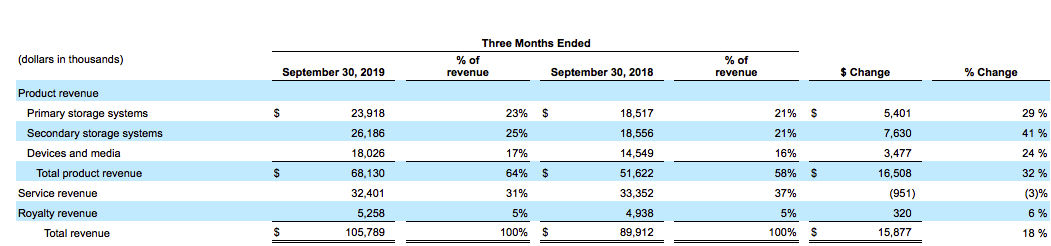
Y/Y sales of primary storage systems are up 29%, secondary storage systems 41%, device and media 24%, royalties 6%, service revenue down 3%.
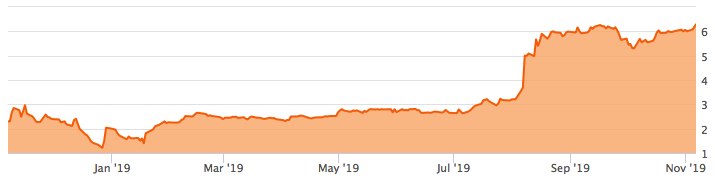
Evolution of Quantum's share
No earnings call transcript was published.
Fiscal year results ended March 31
| (in $ million) | Revenue | Growth | Net income (loss) |
| 1998 | 1,189.8 | NA |
170.8 |
| 1999 | 1,302.7 | 9% | (29.5) |
| 2000 | 1,418.9 | 9% | 40.8 |
| 2001 | 1,405.8 | -1% | 160.7 |
| 2002 | 1,087.8 | -23% | 42.5 |
| 2003 | 870.8 | -20% | (264.3) |
| 2004 | 808.3 | -7% | (62.0) |
| 2005 | 794.2 | -2% | (3.5) |
| 2006 | 834.3 | +5% | (41.5) |
| 2007 | 1,016.2 | +22% | (64.1) |
| 2008 | 975.7 | -4% | (60.2) |
| 2009 | 809.0 | -17% | (356.1) |
| 2010 | 681.4 | -16% | 16.6 |
| 2011 | 672.3 | -1% | 4.5 |
| 2012 | 652.4 | -3% | (8.8) |
| 2013 | 587.6 | -10% | (52.4) |
| 2014 | 553.2 | -6% | (21.5) |
| 2015* | 543.7 | -2% | 15.4 |
| 2016* | 479.8 | -12% | (75.6) |
| 2017* | 493.1 | 3% | (2.4) |
| 2018 |
437.7 |
-11% | (43.3) |
| 2019 |
402.7 |
-8% | (42.8) |
| 2020 (estimation) |
424-430 |
5-7% | NA |
* figures as restated


 Subscribe to our free daily newsletter

