









Seagate: Fiscal 1Q20 Financial Results
Sales down 14% Q/Q despite nearline high-capacity HDDs up 36% in units
This is a Press Release edited by StorageNewsletter.com on November 4, 2019 at 2:53 pm| (in $ million) | 1Q19 | 1Q20 | Growth |
| Revenue |
2,991 | 2,578 | -14% |
| Net income (loss) | 450 | 200 |
Seagate Technology plc reported financial results for its fiscal first quarter ended October 4, 2019.
“Seagate had a solid start to the fiscal year; we grew revenue, expanded non-GAAP operating income, and increased non-GAAP EPS Q/Q reflecting our focus on optimizing profitability to drive free cash flow,” said Dave Mosley, CEO. “Exabyte shipments were near record levels in 1Q20 driven by improving demand conditions for mass capacity storage. We are ramping shipments of our industry capacity leading 16TB drives to support strong customer demand. We continue to gain momentum with these products, which deliver lower TCO to our customers. While business conditions remain challenging over the near-term amidst ongoing geopolitical uncertainties, our innovative technology roadmap makes us well positioned to capture current and future mass capacity storage demand while also driving long-term value for our shareholders.”
The company generated $456 million in cash flow from operations and $309 million in free cash flow during 1Q20.
It has a healthy balance sheet and during 1Q20, paid cash dividends of $170 million and repurchased 9.2 million ordinary shares for $450 million.
Cash and cash equivalents totaled $1.8 billion at the end of the quarter.
The company restructured debt, lowering annual interest expense and reducing total debt to $4.1 billion at the end of the quarter. There were 263 million ordinary shares issued and outstanding as of the end of the quarter.
The board of directors declared a quarterly cash dividend of $0.65 per share, which will be payable on January 8, 2020 to shareholders of record as of the close of business on December 26, 2019.
The company is providing the following guidance for its 2FQ20:
• Revenue of $2.72 billion, plus or minus 5%
• Non-GAAP diluted EPS of $1.32, plus or minus 5%
Comments
Compared to the prior quarter, revenue increased 9% to $2.58 billion, above guidance midpoint, but -14% Y/Y, especially as HDD ASPs is down at only at $70.5, the same figure recorded in 3FQ18.
Remaining the indisputable HDD leader in the world since several quarters, Seagate saw increase in revenue, non-GAAP operating profit, earnings per share, cash flow Q/Q, but net income falls more than 50% in 1FQ20.
Note that, as for WD, the 3 months ended October 4, 2019 consisted of 14 weeks and the three months ended September 28, 2018 consisted of 13 weeks.
Revenue from the edge compute market, including desktop and notebook price, contributed 17% of total revenue compared to 18% in 4FQ19.
Exabyte shipments increased 7% sequentially to 15EB, reflecting seasonal demand for both desktop and notebook drives.
Competition between Seagate, Toshiba and WD is especially fierce in high-capacity near-line HDDs.
In the September quarter, Seagate delivered double-digit revenue growth in nearline, supported by improving demand across cloud and hyperscale customers. It is ramping its 16TB nearline HDDs.
It expects these 16TB models to be its highest enterprise revenue product in 2FQ20 and the largest company revenue contributor in 3FQ20.
Sales for the enterprise market, which include nearline and mission critical drives, represent 45% of 1FQ20 revenue, up from 41% in 4FQ19. Exabyte shipments into the enterprise market increased 34% sequentially to 51EB, with nearline drives representing the vast majority of that total. Average capacity for nearline drive increased 10% Q/Q, reflecting the transition to higher capacity volume.
The manufacturer is preparing to ship 18TB drives in the first half of calendar year 2020. It is also increasing areal density with HAMR technology, which enables to achieve at least 20% areal density CAGR over the next decade. It remains on track to ship 20TB HAMR HDDs in late calendar year 2020.
It generated revenue from its MACH.2 dual actuator solutions for the first time in the September quarter and expect to see demand for this technology to increase as customers transition to drive capacities above 20TB.
Exabyte shipments increased 16% Q/Q to 98EB, driven largely by nearline products.
Revenue from video and image applications declined in the current quarter following an unusually strong former period
Within its tiny SSD business, the pricing environment has been challenging for multiple quarters. Main focus has been on enterprise SSDs.
Seagate forecasts the mass capacity storage revenue TAM will more than double from current levels by 2025, supported by ongoing demand from the public cloud to build out of the private cloud and emerging edge storage applications.
Average capacity per drive
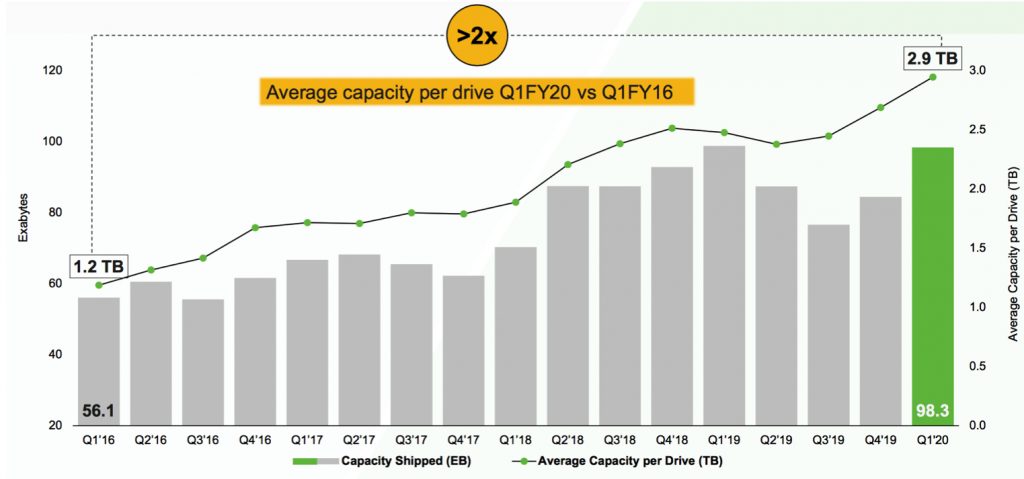
HDD product mix trends
| (units in million) | 4FQ19 | 1FQ20 |
| EB enterprise mission critical | 2.9 | 3.2 |
| EB enterprise nearline | 34.8 | 47.4 |
| EB edge non-compute consumer electronics | 22.7 | 22.0 |
| EB edge non-compute consumer | 10.4 | 11.1 |
| EB edge compute, desktop+notebook | 13.7 | 14.7 |
| Enterprise as % of total revenue | 41% | 45% |
| Edge non-compute as % of total revenue | 34% | 31% |
| Edge compute as % of total revenue | 18% | 17% |
Revenue by products in $ million
| 4FQ19 | 1FQ20 | Q/Q Growth | % of total revenue in 1FQ20 |
|
| HDDs | 2,204 | 2,390 | 8% | 93% |
| Enterprise data solutions, SSD and others |
167 | 188 | 13% | 7% |
Seagate's HDDs from 2FQ15 to 4FQ19
| Fiscal period | HDD ASP | Exabytes shipped |
Average GB/drive |
| 2Q15 | $61 | 61.3 | 1,077 |
| 3Q15 | $62 | 55.2 | 1,102 |
| 4Q15 | $60 | 52.0 | 1,148 |
| 1Q16 | $58 | 55.6 | 1,176 |
| 2Q16 | $59 | 60.6 | 1,320 |
| 3Q16 | $60 | 55.6 | 1,417 |
| 4Q16 | $67 | 61.7 | 1,674 |
| 1Q17 | $67 | 66.7 | 1,716 |
| 2Q17 | $66 | 68.2 | 1,709 |
| 3Q17 | $67 | 65.5 | 1,800 |
| 4Q17 | $64 | 62.2 | 1,800 |
| 1Q18 | $64 | 70.3 | 1,900 |
| 2Q18 | $68 | 87.5 | 2,200 |
| 3Q18 | $70.5 | 87.4 | 2,400 |
| 4Q18 |
$72 | 92.9 | 2,500 |
| 1Q19 | $70 | 98.8 | 2,500 |
| 2Q19 |
$68 | 87.4 | 2,400 |
| 3Q19 |
$72 | 76.7 | 2,400 |
| 4Q19 | $79.7 | 84.5 | 2,700 |
| 1FQ20 |
$70.5 |
98.3 |
2,900 |
Seagate vs. WD for 4FQ19
(revenue and net income in $ million, units in million)
| Seagate | WD | % in favor of WD |
|
| Revenue | 2,578 | 4,040 | 57% |
| Net income | 200 | (278) | NA |
| HDD shipped | 33.9 | 29.3 | -14% |
| Average GB/drive | 2,900 | 4,025 | 39% |
| Exabytes shipped | 98.3 | 131 | 33% |
| HDD ASP | 70.5 | $81 | 15% |








 Subscribe to our free daily newsletter