









Western Digital: Fiscal 1Q20 Financial Results
FY20 off to good start Q/Q not Y/Y, and CEO to retire
This is a Press Release edited by StorageNewsletter.com on November 1, 2019 at 2:41 pm| (in $ million) | 1Q19 | 1Q20 | Growth |
| Revenue |
5,028 | 4,040 | -20% |
| Net income (loss) | 511 | (278) |
Western Digital Corp. reported revenue of $4.0 billion for its first fiscal quarter ended October 4, 2019.
The operating loss was $129 million with a net loss of $276 million, or ($0.93) per share. Excluding certain non-GAAP adjustments, the company achieved non-GAAP operating income of $235 million and non-GAAP net income of $101 million, or $0.34 per share.
In 1Q19, the company reported revenue of $5.0 billion, operating income of $686 million and net income of $511 million, or $1.71 per share. Non-GAAP operating income in 1FQ19 was $1.1 billion and non-GAAP net income was $906 million, or $3.04 per share. The company’s 1FQ20 was a 14-week fiscal quarter, compared to a 13-week fiscal quarter for the year-ago quarter.
It generated $253 million in cash from operations during 1FQ20, and ended the quarter with $3.2 billion of total cash and cash equivalents. It returned $147 million to shareholders through dividends and used $319 million to reduce debt. On August 7, 2019, it declared a cash dividend of $0.50 per share of its common stock, which was paid to shareholders on October 22, 2019.
“FY20 is off to a good start. The continued success of our capacity enterprise drives for the data center was the primary driver of the upside we experienced in 1FQ20,” said Steve Milligan, CEO. “The overall demand environment remains solid. We continue to believe the flash industry has passed a cyclical trough, with improving trends across our flash product portfolio. With a broad and growing product portfolio, Western Digital remains well positioned to benefit from the long-term drivers of the growth and value of data.”
Comments
"FY20 is off to a good start," commented CEO Steve Milligan.
Global revenue at $4,040 billion is down 20% Y/Y but up 11% Q/Q, exceeding high-end of the guidance.
In fact these figures are based on 14-week 1FQ20, compared to a 13-week 1FQ19. Corresponding to this change, sales based a 13-week basis are $3.751 billion down 25% Y/Y and up 9% Q/Q.
These yearly bad figures probably explain why Milligan will retire.
Upside in Q/Q results are driven primarily by:
• Capacity enterprise drives jumping
• Gaining momentum in NVMe-based enterprise SSDs
• Improving trends in flash product portfolio as the firm moves past cyclical trough
• Overall demand environment across data center, mobile, PC and retail end markets being solid
Flash
• Ramp of NVMe-based enterprise SSDs to major hyperscale and OEMs
• BiCS4 (96-layer) bit production surpassed BiCS3 (64-layer)
• Anticipate calendar year 2020 industry bit supply growth in the low-30% range Y/Y compared mid-20% range Y/Y in 2019.
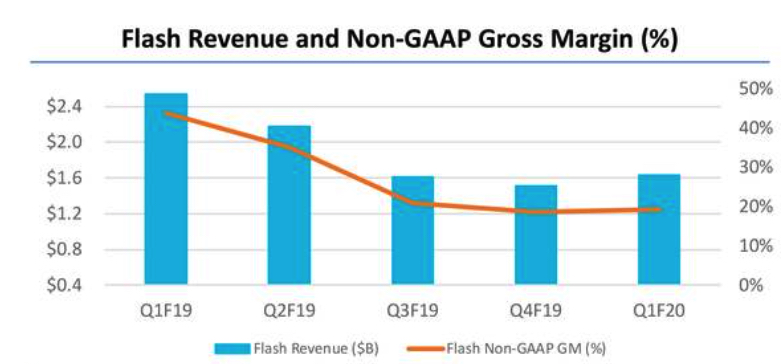
• Bit shipments flat Q/Q, up 9% Q/Q ASP/GB
• Average retail unit capacity up 80% Y/Y and up 29% Y/Y average cSSD unit capacity
Client devices:
• Revenue up 1% on a sequential basis and down 39% Y/Y. The yearly decline was a result of firm's decision to scale back flash bit shipments to the mobile market, flash price declines and a reduction in the HDD market.
• Gaining market share in client SSDs for PCs and notebooks
• Strong growth in exabyte shipment for client NVMe SSDs
Client solutions
• Revenue declining 4% Y/Y primarily due to reduction in HDD global market
• Maintaining premium brand position
• Strong growth in external SSDs
• Continued growth in average unit capacities for flash
• Improving pricing environment and a seasonal increase in bit shipments
• Began shipping 96-layer QLC-based retail products and external SSDs
HDD
• Strong shipments of 14TB capacity enterprise drives
• Sampling 16 and 18TB CMR and 20TB SMR energy-assisted drives in the December quarter
• Began shipping new generation of 10TB drive
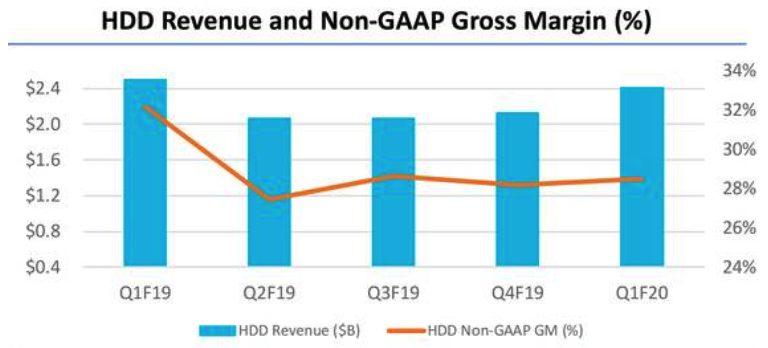
• Total exabytes up 23% Q/Q
• Average ASP per drive up 7% Q/Q
• Capacity enterprise exabyte shipments up over 60% Y/Y
• Capacity enterprise market exabyte growth estimated to be up 30% Y/Y in calendar 2019 and mid-30% range Y/Y in calendar 2020
JV partner with K1 fab executed well bringing the Yokkaichi fabs back to full production after the power outage limiting output reduction 45EB, according to WD.
The company will begin to exit of storage systems business in 2FQ20.
WD currently employs about 62,000 people, the majority being more than 61 years old.
Outlook for 2FQ20: total revenue between $4.1 and 4.3 billion or a growth of +1% to +6%
HDD and flash revenue
| in $ million | 1FQ18 | 1FQ19 | 2FQ19 |
3FQ19 |
4FQ19 |
1FQ20 |
4Q19/1Q20 growth |
| HDD |
2,610 | 2,494 | 2,060 | 2,064 |
2,128 |
2,408
|
+13% |
| Flash |
2,571 | 2,534 | 2,173 | 1,610 | 1,506 | 1,632 | +8% |
| Exabyte metrics | 1FQ19 | 2FQ19 | 3FQ19 | 4FQ19 |
1FQ20 |
| Q/Q change in HDD exabytes sold (1) | -6% | -17% | 13% | 14% | 23% |
| Q/Q change in flash exabytes sold (1) | 28% | 5% | -5% | -1% | 9% |
| Q/Q change in total exabytes sold (1) | -3% | -15% | 11% | 12% | 22% |
| Flash metrics | 1FQ19 | 2FQ19 | 3FQ19 | 4FQ19 |
1FQ20 |
| Q/Q change in ASP/GB (1) | -16% | -18% | -23% | -6% | 0% |
(1) Excludes licensing, royalties, and non-memory products.
Volume and HDD Share
(units in million)
| Client compute units (5) |
Non-compute units (6) |
Data centers units (7) |
Total HDDs (8) |
Exabytes Shipped |
ASP (9) |
|
| 2FQ18 |
21.1 | 14.4 | 6.8 | 42.3 |
NA | $63 |
| 3FQ18 |
17.6 | 11.2 | 7.6 | 36.4 |
NA | $72 |
| 4FQ18 |
17.8 | 13.7 | 7.5 | 39.0 |
NA | $70 |
| 1FQ19 | 16.3 | 11.2 | 6.6 | 34.1 | 103.3 | $72 |
| 2FQ19 |
14.0 | 11.3 | 5.1 | 30.2 |
75.9 |
$67 |
| 3FQ19 |
12.9 | 9.3 | 5.6 | 27.8 | 97.5 | $73 |
| 4FQ19 |
12.3 | 9.2 | 6.2 | 27.7 | 111.5 | $75 |
| 1FQ20 |
12.9 |
8.9 |
7.5 |
29.3 |
131 |
$81 |
(6) Non-compute products consist of retail channel and consumer electronics HDDs.
(7) Data center products consist of enterprise HDDs (high-capacity and performance) and enterprise systems
(8) HDD unit volume excludes data storage systems and media
(9) HDD ASP is calculated by dividing HDD revenue by HDD units. Data storage systems are excluded from this calculation, as data storage systems ASP is measured on a per system basis rather than a per drive basis








 Subscribe to our free daily newsletter