


Cloud IT Infrastructure Revenue Down 10% Y/Y at $14 Billion
Amid slow down in overall spending
This is a Press Release edited by StorageNewsletter.com on October 1, 2019 at 2:33 pmAccording to the International Data Corporation‘s Worldwide Quarterly Cloud IT Infrastructure Tracker, vendor revenue from sales of IT infrastructure products (server, enterprise storage, and Ethernet switch) for cloud environments, including public and private cloud, declined 10.2% Y/Y in 2Q19, reaching $14.1 billion.
The analysts also lowered their forecast for total spending on cloud IT infrastructure in 2019 to $63.6 billion, down 4.9% from last quarter’s forecast and changing from expected growth to a Y/Y decline of 2.1%.
Vendor revenue from hardware infrastructure sales to public cloud environments in 2Q19 was down 0.9% compared to 1Q19 and down 15.1% Y/Y to $9.4 billion. This segment of the market continues to be highly impacted by demand from a handful of hyperscale service providers, whose spending on IT infrastructure tends to have visible up and down swings.
After a strong performance in 2018, IDC expects the public cloud IT infrastructure segment to cool down in 2019 with spend dropping to $42.0 billion, a 6.7% decrease from 2018. Although it will continue to account for most of the spending on cloud IT environments, its share will decrease from 69.4% in 2018 to 66.1% in 2019.
In contrast, spending on private cloud IT infrastructure has showed more stable growth since IDC started tracking sales of IT infrastructure products in various deployment environments. In 2Q19, vendor revenues from private cloud environments increased 1.5% Y/Y reaching $4.6 billion. IDC expects spending in this segment to grow 8.4% Y/Y in 2019.
Overall, the IT infrastructure industry is at crossing point in terms of product sales to cloud vs. traditional IT environments. In 3Q18, vendor revenues from cloud IT environments climbed over the 50% mark for the first time but fell below this important tipping point since then. In 2Q19, cloud IT environments accounted for 48.4% of vendor revenues. For the year 2019, spending on cloud IT infrastructure will remain just below the 50% mark at 49.0%. Longer-term, however, the research company expects that spending on cloud IT infrastructure will grow steadily and will sustainably exceed the level of spending on traditional IT infrastructure in 2020 and beyond.
Spending on the three technology segments in cloud IT environments is forecast to deliver growth for Ethernet switches while compute platforms and storage platforms are expected to decline in 2019. Ethernet switches are expected to grow at 13.1%, while spending on storage platforms will decline at 6.8% and compute platforms will decline by 2.4%. Compute will remain the largest category of spending on cloud IT infrastructure at $33.8 billion.
Sales of IT infrastructure products into traditional (non-cloud) IT environments declined 6.6% from a year ago in Q219. For 2019, WW spending on traditional non-cloud IT infrastructure is expected to decline by 5.8%, as the technology refresh cycle driving market growth in 2018 is winding down this year. By 2023, IDC expects that traditional non-cloud IT infrastructure will only represent 41.8% of total WW IT infrastructure spending (down from 52.0% in 2018). This share loss and the growing share of cloud environments in overall spending on IT infrastructure is common across all regions.
Most regions grew their cloud IT infrastructure revenues in 2Q19. Middle East and Africa was fastest growing at 29.3% Y/Y, followed by Canada at 15.6% Y/Y growth. Other growing regions in 2Q19 included Central and Eastern Europe (6.5%), Japan (5.9%), and Western Europe (3.1%).
Cloud IT infrastructure revenue was down slightly Y/Y in AsiaPac (excluding Japan) by 7.7%, Latin America by 14.2%, China by 6.9%, and the USA by 16.3%.
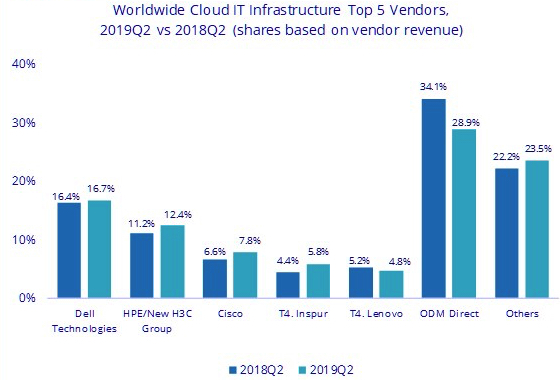
Top Companies, WW Cloud IT Infrastructure Vendor Revenue,
Market Share, and Y/Y Growth, 2Q19
(in $ million)
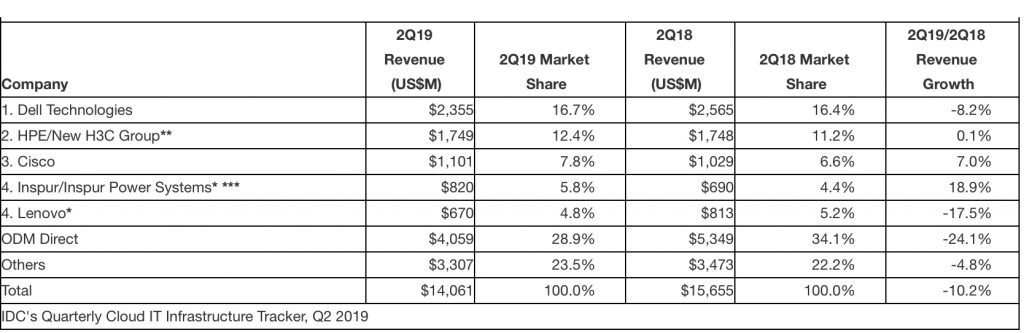
Notes:
* IDC declares a statistical tie in the worldwide cloud IT infrastructure market when there is a difference of 1% or less in the vendor revenue shares among 2 or more vendors.
** Due to the existing joint venture between HPE and the New H3C Group, IDC reports external market share on a global level for HPE as HPE/New H3C Group starting from 2Q16 and going forward.
*** Due to the existing joint venture between IBM and Inspur, IDC will be reporting external market share on a global level for Inspur and Inspur Power Systems as Inspur/Inspur Power Systems starting from 3Q18.
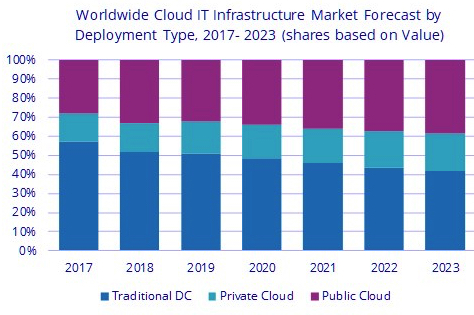
Long-term, IDC expects spending on cloud IT infrastructure to grow at a 5-year CAGR of 6.9%, reaching $90.9 billion in 2023 and accounting for 58.2% of total IT infrastructure spend. Public cloud datacenters will account for 66.0% of this amount, growing at a 5.9% CAGR. Spending on private cloud infrastructure will grow at a CAGR of 9.2%.
Taxonomy Notes
IDC defines cloud services more formally through a checklist of key attributes that an offering must manifest to end users of the service. Public cloud services are shared among unrelated enterprises and consumers; open to a largely unrestricted universe of potential users; and designed for a market, not a single enterprise. The public cloud market includes variety of services designed to extend or, in some cases, replace IT infrastructure deployed in corporate datacenters. It also includes content services delivered by a group of suppliers IDC calls Value Added Content Providers. Private cloud services are shared within a single enterprise or an extended enterprise with restrictions on access and level of resource dedication and defined/controlled by the enterprise (and beyond the control available in public cloud offerings); can be onsite or offsite; and can be managed by a third-party or in-house staff. In private cloud that is managed by in-house staff, vendors (cloud service providers) are equivalent to the IT departments/shared service departments within enterprises/groups. In this utilization model, where standardized services are jointly used within the enterprise/group, business departments, offices, and employees are the service users.
IDC defines compute platforms as compute intensive servers. Storage Platforms includes storage intensive servers as well as external storage and storage expansion (JBOD) systems. Storage intensive servers are defined based on high storage media density. Servers with low storage density are defined as compute intensive systems.
Storage platforms does not include internal storage media from compute intensive servers. There is no overlap in revenue between compute platforms and storage platforms, in contrast with IDC’s Server Tracker and Enterprise Storage Systems Tracker, which include overlaps in portions of revenue associated with server-based storage.


 Subscribe to our free daily newsletter

