


Western Digital: Fiscal 4Q19 Financial Results
Challenging quarter and fiscal year
This is a Press Release edited by StorageNewsletter.com on August 1, 2019 at 2:21 pm| (in $ million) | 4Q18 | 4Q19 | FY18 | FY19 |
| Revenue | 5,117 | 3,634 | 20,647 | 16,569 |
| Growth | -29% | -20% | ||
| Net income (loss) | 756 | (197) | 675 | (754) |
Western Digital Corp. reported revenue of $3.6 billion for its fourth fiscal quarter ended June 28, 2019.
The operating loss was $381 million with a net loss of $197 million, or ($0.67) per share. Excluding certain non-GAAP adjustments, the company achieved non-GAAP operating income of $158 million and non-GAAP net income of $50 million, or $0.17 per share.
In 4FQ18, the company reported revenue of $5.1 billion, operating income of $843 million and net income of $756 million, or $2.46 per share. Non-GAAP operating income in the year-ago quarter was $1.3 billion and non-GAAP net income was $1.1 billion, or $3.61 per share.
The company generated $169 million in cash from operations during 4FQ19, and ended the quarter with $3.5 billion of total cash and cash equivalents. The company returned $146 million to shareholders through dividends. On May 2, 2019, the company declared a cash dividend of $0.50 per share of its common stock, which was paid to shareholders on July 15, 2019.
For FY19, the company achieved revenue of $16.6 billion, operating income of $87 million and net loss of $754 million, or ($2.58) per share, compared to FY18 revenue of $20.6 billion, operating income of $3.6 billion and net income of $675 million, or $2.20 per share.
On a non-GAAP basis, FY19 operating income was $2.0 billion and net income was $1.4 billion, or $4.84 per share, compared to FY18 operating income of $5.4 billion and net income of $4.5 billion, or $14.73 per share.
The company generated $1.5 billion in cash from operations during fiscal year 2019 and returned $1.1 billion to shareholders through share repurchases and dividends.
“We ended a challenging fiscal 2019 with leadership positions in capacity enterprise hard drives, 3D flash technology and branded retail products while achieving significant gains in client SSDs,” said Steve Milligan, CEO. “Momentum for our NVMe enterprise SSDs is picking up, setting the stage for further gains across our portfolio in the new fiscal year and beyond.“
He continued: “We are seeing signs of improving conditions in the flash market and believe that it has reached a cyclical trough. With continuing expectations for a positive demand environment, a robust product portfolio and expanding customer engagements, we expect to deliver improving financial results as we move through FY20.”
Business outlook for 1FQ20 that will be 14-week fiscal quarter: revenue between $3.8 and $4.0 billion
(this range includes approximately $50 million of startup costs associated with investment in the K1 fab)
Comments
With quarterly revenue plunging 29% Y/Y and 1% Q/Q, and decreasing 20% from FY18 to FY19, Western Digital is shrinking, like in the former 3FQ19 quarter with all main figures down including sales by 27% Y/Y and loss increasing, even if it ended FY19 with an expanded market presence in both capacity enterprise and client SSDs, and if it began building momentum for enterprise SSDs, and expects a stronger demand environment for 2HCQ19 and remains intact for both flash and HDDs products.
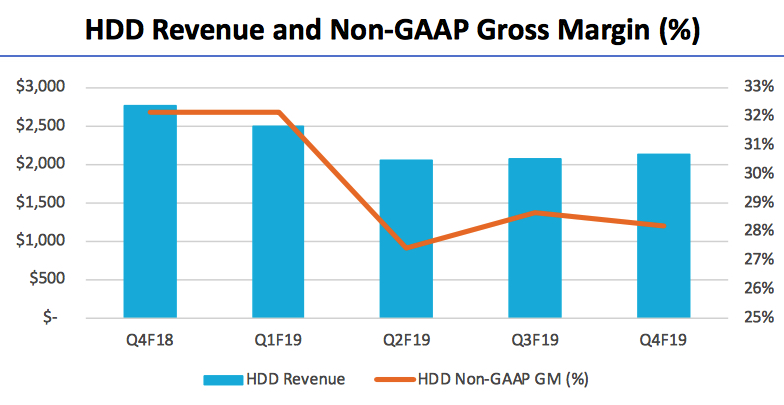
HDD
- 14TB drives has been qualified at virtually all hyperscale and OEM customers and the firm is on track to deliver 16TB and 18TB energy assisted recording drives in CY19.
- In 4FQ19, total exabytes shipped were up +14% Q/Q at 111.5EB and average unit capacity increased +14% Q/Q.
- Capacity enterprise exabyte shipments grew mid- single digits Y/Y for 1HCY19
- Capacity enterprise market exabyte growth is expected to exceed 30% Y/Y growth in CY19.
- HDD inventory decreased due to the drawdown of inventory built to enable the Kuala Lumpur facility closure.
- President and CEO Cordano also comments: "There have been some market rumors suggesting that customers are skipping the 14TB generation to adopt the 16TB capacity point, but our demonstrated performance with our 14TB offering should invalidate those claims."
- In the September quarter, WD expects to see a strong revenue ramp of its drive managed SMR products, allowing to meaningfully participate with compelling surveillance portfolio.
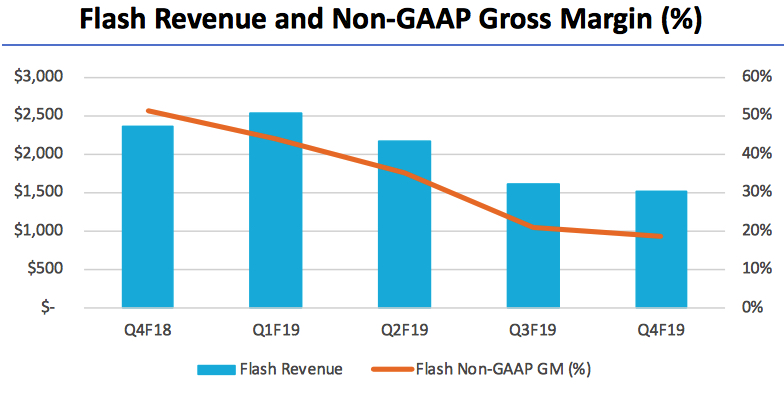
Flash
- Internally developed enterprise NVMe SSDs were commencing revenue ramp at major hyperscale and OEMs in the current quarter.
- The firm estimates that that the industry's transition to BiCS4 (96-layer 3D flash) technology and supply bit cross over exiting September 2019 quarter. It expects to ship in each of the product lines before the end of CY19.
- In 4FQ19, bit shipments were down -1% Q/Q and average unit capacity for retail flash was up +36% Y/Y.
- WD doubled its client SSD exabyte shipments due to the strength of its portfolio.
- Non-retail client SSDs increased +78% Y/Y.
- In client solutions, the firm sees continuing success in the external SSD category with further expansion in its market share.
- For client SSDs, shipments of NVMe based products grew significantly, representing nearly 50% of client SSD revenue. As price points have declined, customers are migrating to higher capacity points and the average capacity per unit of client SSDs increased 50% on a Y/Y basis.
- Next week at the Flash Memory Summit, WD will be announcing additional enterprise NVMe products, implemented with BiCS4. It expects a significant acceleration of its enterprise NVMe product revenue over the course of FY20 and beyond.
- Industry bit supply is expected to reach Y/Y growth in low 20% range in CY19.
- WD is confident that its capacity enterprise exabytes shipment growth will meaningfully exceed 30% for this calendar year.
- The company provides some comments on three topics, Huawei, the Yokkaichi JV fabs and flash inventory. Effective May 16, the US Commerce Department's Bureau of Industry and Security or BIS added Huawei to its entity list. WD stopped shipments to Huawei at that time. After discussions with the Commerce Department on the relevant laws and regulations, it determined that the entity list regulations do not apply to products that were previously qualified for Huawei and it started resuming shipments of those products to Huawei in mid-June. The vendor business activities that are subject to the entity list restrictions remain on hold. But it has applied for the BIS for a license to resume those activities.
- WD sees a normalizing flash supply and inventory environment in CY19.
- Turning to the Yokkaichi fabs, an unexpected power outage occurred on June 15, affecting production operations at the flash fabrication facilities operated by TMC. Since that event, the WD and TMC teams have worked on recovery activities. And as of now, nearly all of the equipment in the fabs has returned to normal operations. Consistent with WD's prior comments, the disruption to fab operations caused a loss of approximately 6EB of wafer output for the company, with most of the wafer output impact expected to be contained in the September quarter.
On a sequential basis, data center devices and solution revenue increased 2%, because of continued strength in capacity enterprise drives.
Client devices revenue declined slightly, as growth in the client SSD market was offset by declines in the client HDD and flash mobile applications.
Flash inventory also decreased, primarily due to scrap of work-in process inventory at the fab as a result of the power outage. The company expects both flash and hard drive inventories to decline further in the September quarter.
Due to market conditions and geopolitical dynamics, the manufacturer reduced its participation in mobile during the June quarter and expects to see recovery of its participation in mobile in the September quarter.
Main competitor Seagate is supposed to announce its financial results for the same period in two days.
HDD and SSD revenue
| in $ million | 1FQ18 | 1FQ19 | 2FQ19 |
3FQ19 |
4FQ19 |
3Q/4Q19 growth |
| HDD |
2,610 | 2,494 | 2,060 | 2,064 |
2,128 |
+3% |
| SSD |
2,571 | 2,534 | 2,173 | 1,610 | 1,506 | -6% |
| Exabyte metrics | 1FQ19 | 2FQ19 | 3FQ19 | 4FQ19 |
| Q/Q change in HDD exabytes sold (1) | -6% | -17% | 13% | 14% |
| Q/Q change in flash exabytes sold (1) | 28% | 5% | -5% | -1% |
| Q/Q change in total exabytes sold (1) | -3% | -15% | 11% | 12% |
| Flash metrics | 1FQ19 | 2FQ19 | 3FQ19 | 4FQ19 |
| Q/Q change in ASP/GB (1) | -16% | -18% | -23% | -6% |
(1) Excludes licensing, royalties, and non-memory products.
Volume and HDD Share
(units in million)
| Client compute units (5) |
Non-compute units (6) |
Data centers units (7) |
Total HDDs (8) |
Exabytes Shipped |
ASP (9) |
|
| 2FQ18 |
21.1 | 14.4 | 6;8 | 42.3 |
NA | $63 |
| 3FQ18 |
17.6 | 11.2 | 7.6 | 36.4 |
NA | $72 |
| 4FQ18 |
17.8 | 13.7 | 7.5 | 39.0 |
NA | $70 |
| 1FQ19 | 16.3 | 11.2 | 6.6 | 34.1 | 103.3 | $72 |
| 2FQ19 |
14.0 | 11.3 | 5.1 | 30.2 |
75.9 |
$67 |
| 3FQ19 |
12.9 | 9.3 | 5.6 | 27.8 | 97.5 | $73 |
| 4FQ19 |
12.3 |
9.2 |
6.2 |
27.7 |
111.5 |
$73 |
(6) Non-compute products consist of retail channel and consumer electronics HDDs.
(7) Data center products consist of enterprise HDDs (high-capacity and performance) and enterprise systems
(8) HDD unit volume excludes data storage systems and media
(9) HDD ASP is calculated by dividing HDD revenue by HDD units. Data storage systems are excluded from this calculation, as data storage systems ASP is measured on a per system basis rather than a per drive basis


 Subscribe to our free daily newsletter


