


1CQ19 WW Server Market Revenue Up 4% Y/Y and Down 5% Q/Q – IDC
Top market shares: Dell 20%, HPE (17%), Inspur, Supermicro and Lenovo (6%), Huawei (5%)
This is a Press Release edited by StorageNewsletter.com on June 11, 2019 at 2:38 pmAccording to International Data Corporation‘s Worldwide Quarterly Server Tracker, vendor revenue in the WW server market increased 4.4% year over year to $19.8 billion during 1CQ19.
WW server shipments declined 5.1% year over year to just under 2.6 million units in 1CQ19.
The overall server market slowed in 1CQ19 after experiencing six consecutive quarters of double-digit revenue growth although pockets of robust growth remain.
Volume server revenue increased by 4.2% to $16.7 billion, while mid-range server revenue grew 30.2% to $2.1 billion. High-end systems contracted steeply for a second consecutive quarter, declining 24.7% Y/Y to $976 million.
“Demand from both enterprise buyers and hyperscale companies purchasing through ODMs was less voracious than in previous quarters; coupled with a difficult compare period from a year ago, this impacted the pace of market growth during the first quarter,” said Sebastian Lagana, research manager, infrastructure platforms and technologies, IDC. “This was most evident in declining unit shipments during the quarter, although year-to-year ASP increases supported revenue growth for many vendors. As long as demand for richly configured servers supports further ASP growth, the market will offset slight declines in unit volume.”
Overall Server Market Standings, by Company
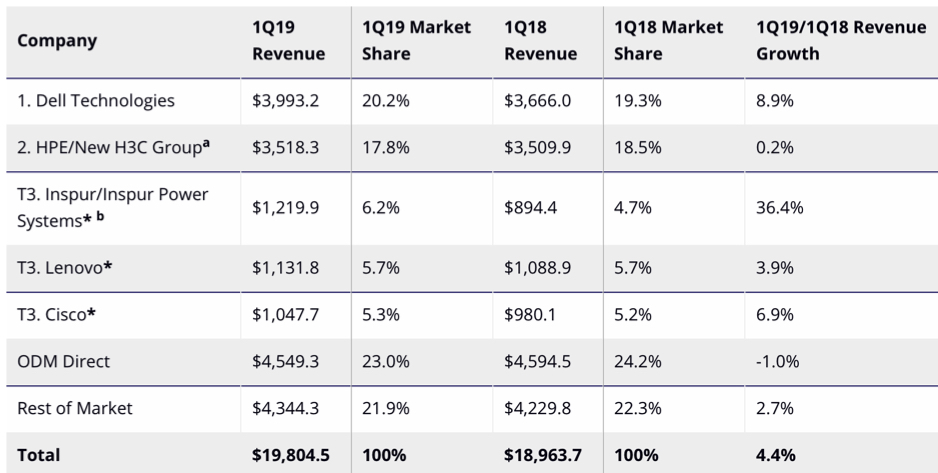
The ≠1 position in the market during 1CQ19 was Dell Technologies with 20.2% revenue share, followed by HPE/New H3C Group, with 17.8% revenue share. Dell Technologies grew revenues 8.9% Y/Y while HPE/New H3C Group increased revenues 0.2%. Tied* for the number 3 position during the quarter were Inspur/Inspur Power Systems, Lenovo, and Cisco, generating 6.2%, 5.7%, and 5.3% share total server revenues, respectively. Inspur/Inspur Power Systems increased its revenue 36.4% year over year; Lenovo grew its revenue 3.9% year over year; and Cisco increased its revenue 6.9% year over year. The ODM Direct group of vendors accounted for 23.0% of total market revenue and declined -1.0% year over year to $4.55 billion.
Top 5 Companies, WW Server Vendor Revenue, Market Share and Growth, 1CQ19
(revenues in $million)
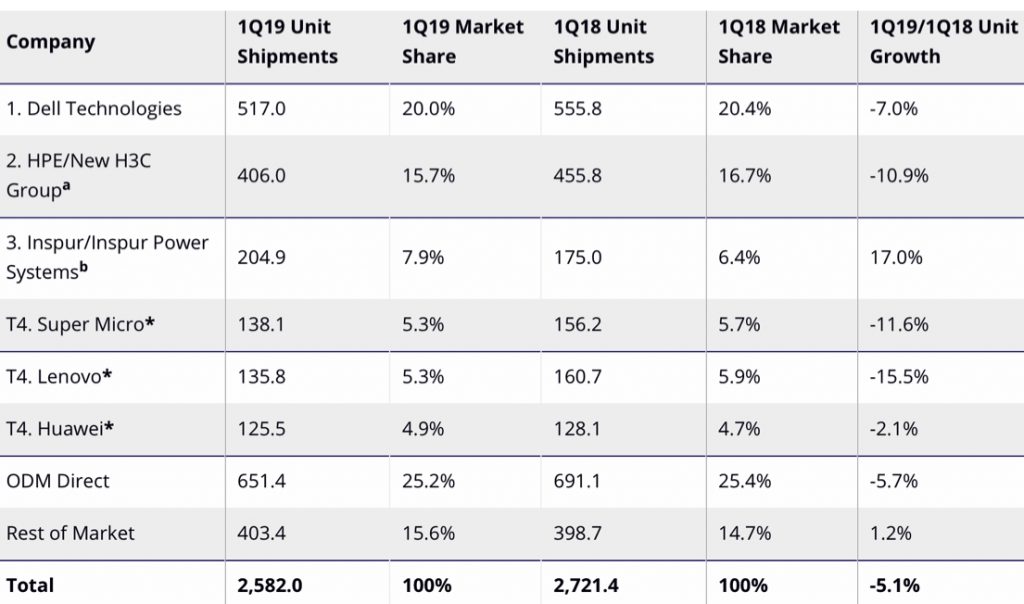
Dell Technologies led the worldwide server market in terms of unit shipments, accounting for 20.0% of all units shipped during the quarter.
Top 5 Companies, WW Server Unit Shipments, Market Share and Growth, 1CQ19
(shipments in thousands)
Notes:
* There is a statistical tie in the WW server market when there is a difference of 1% or less in the share of revenues or shipments among two or more vendors.
a Due to the existing joint venture between HPE and the New H3C Group, IDC will be reporting external market share on a global level for HPE and New H3C Group as HPE/New H3C Group starting from 2CQ16.
b Due to the existing joint venture between IBM and Inspur, IDC will be reporting external market share on a global level for Inspur and Inspur Power Systems as Inspur/Inspur Power Systems starting from 3CQ18.
Top Server Market Findings
On a geographic basis, Japan was the fastest growing region in 1CQ19 with 9.8% Y/Y revenue growth. AsiaPac (excluding Japan) grew 7.4% during the quarter, while Europe, the Middle East and Africa (EMEA) grew 4.1% on aggregate. The United States grew 3.5%; Canada declined 9.6%; and Latin America contracted 14.9%. China saw its 1Q19 vendor revenues grow 11.4% Y/Y.
Demand for x86 servers increased 6.0% in 1Q19 to $18.5 billion in revenue. Non-x86 servers contracted -13.7% Y/Y to $1.3 billion.
IDC’s Server Taxonomy
It maps the eleven price bands within the server market into three price ranges: volume servers, midrange servers and high-end servers. The revenue data presented in this release is stated as vendor revenue for a server system. IDC presents data in vendor revenue to determine market share position. Vendor revenue represents those dollars recognized by multi-user system and server vendors for ISS (initial server shipment) and upgrade units sold through direct and indirect channels and includes the following embedded server components: Frame or cabinet and all cables, processors, memory, communications boards, OS software, other bundled software and initial internal and external disk shipments.


 Subscribe to our free daily newsletter

