









Box: Fiscal 4Q19 Financial Results
Revenue growth and loss continuing but first ever quarter of positive non-GAAP net income per share
This is a Press Release edited by StorageNewsletter.com on March 1, 2019 at 2:20 pm| (in $ million) | 4Q18 | 4Q19 | FY18 | FY19 |
| Revenue | 136.7 | 163.7 | 506.1 | 608.4 |
| Growth | 20% | 20% | ||
| Net income (loss) | (32.7) | (19.7 | (155.0) | (134.6) |
Highlights of 4FQ19:
• Revenue of $163.7 Million, Up 20% Y/Y
• Fourth Quarter Billings of $237.7 Million, Up 16% Y/Y
• Fourth Quarter GAAP Net Loss Per Share was $0.14
• Fourth Quarter Non-GAAP Net Income Per Share of $0.06; First Ever Quarter of Positive Non-GAAP Net Income Per Share
• Fourth Quarter Cash Flow from Operations of $31.3 Million, Up $8.8 Million Y/Y
• Fourth Quarter Free Cash Flow of $21.0 Million, Up $8.8 Million Y/Y
Box, Inc. announced financial results for the fiscal fourth quarter and full fiscal year 2019, which ended January 31, 2019.
“In fiscal 2019, we made progress in our transition to solution selling as demonstrated by strong add-on product attach rates and solid growth in six-figure deals throughout the year,” said Aaron Levie, co-founder and CEO. “While our Q4 billings results were below our expectations – driven by underperformance in EMEA and longer sales cycles for some seven-figure deals – we are encouraged by overall customer momentum and demand for cloud content management. Looking to FY20, we are confident that our leadership position enables us to disrupt the legacy content management market and help our customers accelerate their digital transformation.”
“In the fourth quarter, we continued to drive operational efficiencies, including achieving our first quarter of non-GAAP profitability,” said Dylan Smith, co-founder and CFO. “We remain focused on long-term growth on our path to a billion dollars in revenue and beyond, while driving continued leverage in our business model and targeting our first full year of non-GAAP profitability in FY20.”
4FQ19 Financial Highlights
• Revenue was a record $163.7 million, an increase of 20% (ASC 606 in FY19 compared to ASC 605 in FY18) and 21% (ASC 605 in FY19 compared to ASC 605 in FY18) from the 4FQ18.
• Deferred revenue as of January 31, 2019 was $375.0 million, an increase of 17% (ASC 606 to ASC 605 and ASC 605 to ASC 605) from 4FQ18.
• Billings were $237.7 million, an increase of 16% (ASC 606 to ASC 605 and ASC 605 to ASC 605) from 4FQ18.
• GAAP operating loss was $21.7 million, or 13% of revenue (ASC 606), and $26.4 million, or 16% of revenue (ASC 605). This compares to GAAP operating loss of $32.5 million, or 24% of revenue in 4FQ18.
• Non-GAAP operating income was $8.5 million, or 5% of revenue (ASC 606), and $3.8 million, or 2% of revenue (ASC 605). This compares to a non-GAAP operating loss of $7.5 million, or 5% of revenue in 4FQ18.
• GAAP net loss per share, basic and diluted, was $0.14 (ASC 606) and $0.17 (ASC 605) on 144 million weighted average shares outstanding. This compares to a GAAP net loss per share of $0.24 in 4FQ18 on 137 million weighted average shares outstanding.
• Non-GAAP net income per share, diluted, was $0.06 (ASC 606) and $0.03 (ASC 605) on 150 million weighted average diluted shares outstanding. This compares to non-GAAP net loss per share of $0.06 in 4FQ18.
• Net cash provided by operating activities totaled $31.3 million. This compares to net cash provided by operating activities of $22.5 million in 4FQ18.
• Free cash flow was positive $21.0 million. This compares to positive $12.1 million in 4FQ18.
FY19 Financial Highlights
• Revenue was a record $608.4 million, an increase of 20% (ASC 606 in FY19 compared to ASC 605 in FY18) and 22% (ASC 605 in FY19 compared to ASC 605 in FY18) from FY18.
• Billings were $672.9 million, an increase of 15% (ASC 606 to ASC 605 and ASC 605 to ASC 605) from FY18.
• GAAP operating loss was $134.2 million, or 22% of revenue (ASC 606), and $146.1 million, or 24% of revenue (ASC 605). This compares to GAAP operating loss of $154.0 million, or 30% of revenue, in FY18.
• Non-GAAP operating loss was $14.9 million, or 2% of revenue (ASC 606), and $26.8 million, or 4% of revenue (ASC 605). This compares to a non-GAAP operating loss of $56.0 million, or 11% of revenue, in FY18.
• GAAP net loss per share, basic and diluted, in fiscal year 2019 was $0.95 (ASC 606) and $1.04 (ASC 605) on 141 million weighted average shares outstanding. This compares to a GAAP net loss per share of $1.16 in FY18 on 134 million weighted average shares outstanding.
• Non-GAAP net loss per share, diluted, was $0.12 (ASC 606) and $0.21 (ASC 605). This compares to non-GAAP net loss per share of $0.43 in FY18.
• Net cash provided by operating activities totaled $55.3 million. This compares to net cash provided by operating activities of $35.4 million in FY18.
• Free cash flow was positive $13.8 million. This compares to positive $7.5 million in FY18.
Business Highlights
• Grew paying customer base to more than 92,000 organizations, including new or expanded deployments with enterprises such as Allina Health System, Intuit, Live Nation, MGM Studios, Red Robin International, Inc., Silicon Valley Bank, ServiceNow, State Street, and Vistra Energy.
• Announced the availability of the Box for G Suite Integration, giving customers the power to create and manage Google Docs, Sheets, and Slides from within Box.
• Announced the availability of Box Skills Kit, enabling enterprise customers, third party developers, and system integrators to build custom AI integrations with Box.
• Launched an expanded integration with VMware, powering a more seamless and efficient experience for customers to work with content in Box Drive on VMware App Volumes.
• Announced the availability of the Box and ServiceNow integration, allowing customers to build content-related workflows on the ServiceNow Platform.
• Introduced new Box Sidebar Element and Box Platform developer tools to simplify the application development experience.
• Announced a new, dedicated UK Zone as an expansion of Box’s data residency offering, Box Zones.
• Recognized as a 2019 Gartner Peer Insights Customers’ Choice for Content Services Platforms.
• Recognized as one of Fortune 100 Best Companies to Work For for 2019.
• Welcomed Lakshmi Hanspal as Box’s chief information security officer, leading cyber security practice, security operations, and data and platform protection.
1FQ20 Guidance
Revenue is expected to be in the range of $161 million to $162 million. GAAP and non-GAAP basic and diluted net loss per share are expected to be in the range of $0.29 to $0.28 and $0.06 to $0.05, respectively. Weighted average basic and diluted shares outstanding are expected to be approximately 145 million.
FY20 Guidance
Revenue is expected to be in the range of $700 million to $704 million. GAAP basic and diluted net loss per share are expected to be in the range of $1.06 to $1.02. Non-GAAP basic and diluted net (loss) income per share are expected to be in the range of $(0.03) to $0.01. The weighted average basic and diluted shares outstanding are expected to be approximately 148 million and 156 million, respectively.
Comments
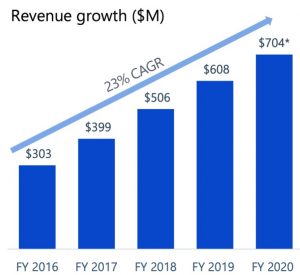
For next quarter revenue is expected to decrease from 1% to 2% but increasing 15% to 16% for FY20.
Abstract of the earnings call transcript:
Aaron Levie, CEO:
"In the quarter we closed 94 deals greater than $100,000 versus 79 a year ago, 12 deals over $500,000 in line with last year and two deals more than $1 million versus one year ago.
"We ultimately underperformed against our seven figure deal expectations in the quarter. These more complex enterprise deals are taking longer to close and as a result a few moved out of the quarter and into pipeline throughout this year.
"As we kick our fiscal 2020, we're focused on two key objectives to drive our next phase of growth on our path to $1 billion in revenue and beyond. Number one, building the category defining cloud content management platform that powers our customers digital processes and number two, accelerating our customers digital transformation with cloud content management through our go-to-market efforts."
Dylan Smith, CFO:
"We now have more than 900 customers paying at least $100,000 annually making up 60% of our recurring revenue.
"The value of our add on product portfolio is up more than 60% year-over-year. Now roughly 14% of our revenue run rate in Q4 versus roughly 10% a year ago.
"Sales and marketing expenses in the quarter were $64.6 million representing 39% of revenue a significant improvement from 51% in the prior year.
"We're entering FY20 with 300 [indiscernible] sales reps up 12% year-over-year. In FY20 we plan to grow our sales force in the range of 10% to 15% focusing on field hirers in the US and Japan. Next research and development expenses were $29.8 million or 18% of revenue flat with a year ago, as we continue to invest in the enhancement of our product offerings. This included the continued development of Box Relay, Box Shield and Box Platform.
"We're focused on driving reacceleration and top line growth in order to achieve our target of $1 billion in revenue for the full year of fiscal 2022."








 Subscribe to our free daily newsletter