


Seagate: Fiscal 2Q19 Financial Results
How awful but profitable
This is a Press Release edited by StorageNewsletter.com on February 7, 2019 at 2:10 pm| (in $ million) | 2Q18 | 2Q19 | 6 mo. 18 | 6 mo. 19 |
| Revenue | 2,914 | 2,715 | 5,546 | 5,706 |
| Growth | -7% | 3% | ||
| Net income (loss) | 159 | 384 | 340 | 834 |
Seagate Technology plc reported financial results for the quarter ended December 28, 2018.
“In the December quarter, we executed well against a more challenging demand environment and delivered solid financial results reflecting strong operational efficiency. While there are market and geo-political uncertainties impacting the storage industry, our belief in the long-term growth of data creation and storage demand remains unchanged. By delivering competitive cost-effective mass storage solutions, Seagate enables the Data Age digital transformations for businesses across many industries. Our deep storage industry expertise and leading technology portfolio will continue to drive long-term success for the company and deliver value to our shareholders,” said Dave Mosley, Seagate’s CEO.
In the second quarter, the company generated $288 million in cash flow from operations and $161 million in free cash flow. Year to date, the company has generated $875 million in cash flow from operations and $571 million in free cash flow. Seagate’s balance sheet is healthy and during the second quarter, the company paid cash dividends of $180 million, repurchased 3.2 million ordinary shares for $136 million and repaid $499 million of the 2018 senior notes. Cash and cash equivalents totaled $1.4 billion at the end of the quarter. There were 283 million ordinary shares issued and outstanding as of the end of the quarter.
Quarterly Cash Dividend
The board declared a quarterly cash dividend of $0.63 per share, which will be payable on April 3, 2019 to shareholders of record as of the close of business on March 20, 2019. The payment of any future quarterly dividends will be at the discretion of the Board and will be dependent upon Seagate’s financial position, results of operations, available cash, cash flow, capital requirements and other factors deemed relevant by the board.
Comments
The HDD market was in deep trouble with rough SSD competition during the quarter and Seagate, almost essentially involved in this sector, is consequently suffering.
Revenue was down 9% Q/Q and 7% Y/Y at $2.7 billion corresponding to Wall Street's expectations, with net income decreasing 15% Q/Q and up 145% Y/Y.
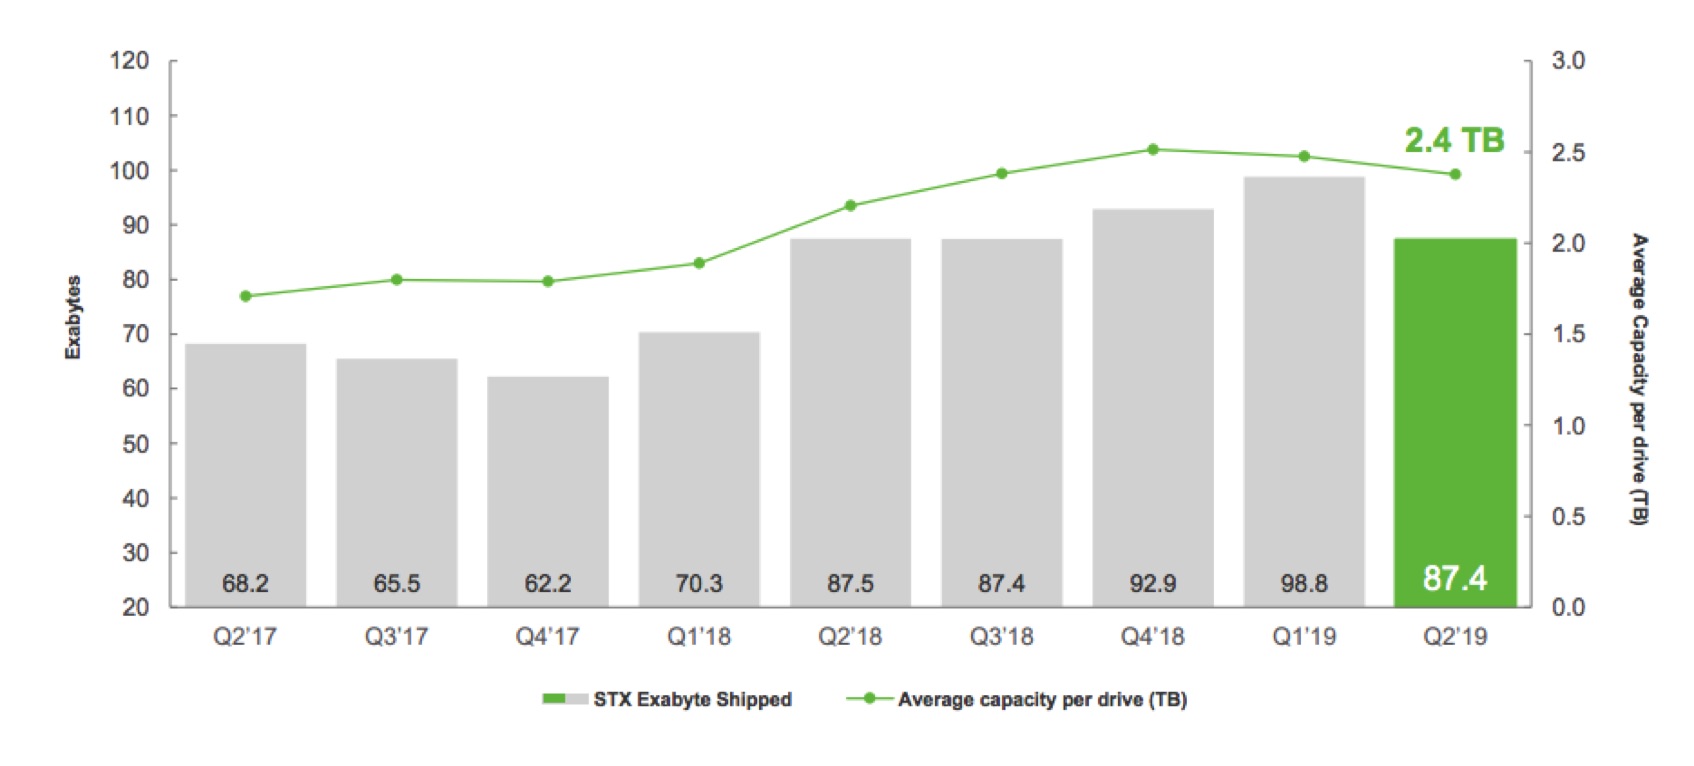
HDD capacity shipped was 87.4EB with an average capacity of 2.4TB per drive, the first figure down for the first time since since 4FQ17, the second figure declining for the first time since 2FQ17.
HDDs shipped decreased to 36.4 million, down from 40 million one year ago, and nearline HDDs is really week for the quarter.
"For the overall HDD industry, the December quarter exabyte demand declined for the first time after six quarters of continued growth," said CEO Dave Mosley.
Nevertheless he is not disappointed: "We executed our plans well and with strong operational efficiency delivered solid financial results."
Exabytes shipped and average capacity per drive
Outside of HDD, revenue from Seagate's enterprise systems, flash, and other category was $225 million, up 18% Q/Q, but representing only 8% of global sales.
Next quarter's outlook: revenue around 2.3 billion or -15% Q/Q, with total exabyte shipments to be 10% to 15% lower sequentially.
Abstracts of the earning call transcript:
Dave Mosley, CEO:
" (...) in the surveillance market, demand was soft compared to this time last year impacted by tightening of downstream customer credit as well as government project delays.
"We're confident in our ability to achieve 16TB, drive shipments in the first half of this calendar year growing to over 20TB next year.
"Our MACH.2 dual-actuator drive unlocks significant capacity with a rough doubling of the I/O bandwidth. We have successfully deployed MACH.2 sample drives at customer sites and for the past six months some of these drives have been serving live production traffic. Later this calendar year we will begin our volume ramp of these important new designs.
"Within our revenue expectation for the March quarter, we anticipate nearline HDD demand to remain soft and our nearline exabyte shipments to be flat to slightly down sequentially. We expect the consumer and gaming markets to be seasonally down in the March quarter and desktop and notebook demand to be slightly lower than seasonal demand as CPU shortage and macro uncertainty overhang continue to affect the volume in these markets. We also expect our cloud systems revenue to be relatively flat sequentially and our SSD revenues to be down sequentially due to product transitions and our near-term conservative approach to the NAND market."
Gianluca Romano, EVP and CFO:
"Cloud system decreased Y/Y due to a planned end of life of some legacy OEM cloud system products.
"In the mission critical market, we continued to address strong demand that resulted in 44% Y/Y exabyte growth with average capacity per drive over 1.1TB, up 30% year-over-year. Our breadth of portfolio up to 2.4TB continues to provide customers with a cost effective solution required for mature enterprise applications.
"In the nearline market, we shipped 33EB and our average capacity per drive exceeded 6.5TB, up 10% over last year and up 44% from the same quarter two years ago. The multi-quarter digestion phase that we are experiencing with cloud service provider customers is temporary affecting the exabyte demand in the overall nearline market. However, demand from OEM enterprise customers for nearline drive remains fairly stable.
"As cloud and enterprise customers transition to higher capacity points, our nearline HDD portfolio is well positioned to monetize storage demand over the long term. Our 12TB nearline drive was the leading enterprise revenue product in the December quarter, as our highest capacity product, the 14TB drive, continues to ramp in volume. Looking ahead, we are on schedule to launch 16TB product in the first half of this calendar year.
"Edge non-compute market includes our consumer surveillance, NAS gaming and DVR portfolio offering. In the December quarter, this market represented 31% of total revenue, 1% higher compared to the December quarter a year ago. We drove Y/Y exabyte growth and increased average capacity per drive for almost all end markets in the December quarter.
"(...) the consumer portfolio at 27% sequential capacity growth was driven by strong seasonal demand and market share gains. While we are confident of the long-term growth and profitability of this market, we are mindful that near-term demand in some markets and channels was impacted by the liquidity issues.
"Edge compute market include desktop and notebook HDD application. In the December quarter, this market represented 21% of total revenue, 2% lower compared to the December quarter a year ago. Total exabyte shipments declined 4% Y/Y and average capacity per drive grew 9% Y/Y."
HDD mix trends
(units in million)
| 1FQ19 | 2FQ19 | |
| EB enterprise mission critical | 3.0 | 3.4 |
| EB enterprise nearline | 42.5 | 33.0 |
| EB client non-compute consumer electronics | 23.4 | 18.4 |
| EB client non-compute consumer | 11.2 | 14.2 |
| EB client compute, desktop+notebook | 18.7 | 18.4 |
| Enterprise as % of total revenue | 42% | 39% |
| Client non-compute as % of total revenue | 31% | 31% |
| Client compute as % of total revenue | 20% | 21% |
Revenue by products in $ million
| 1FQ19 | 2FQ19 | Q/Q Growth | % of total revenue in 2FQ19 |
|
| HDDs | 2,801 | 2,490 | -11% | 92% |
| Enterprise systems, flash and others |
190 | 225 | 18% | 8% |
Seagate's HDDs from 2FQ15 to 2FQ19
| Fiscal period | HDD ASP | Exabytes | Average |
| shipped | GB/drive | ||
| 2Q15 | $61 | 61.3 | 1,077 |
| 3Q15 | $62 | 55.2 | 1,102 |
| 4Q15 | $60 | 52.0 | 1,148 |
| 1Q16 | $58 | 55.6 | 1,176 |
| 2Q16 | $59 | 60.6 | 1,320 |
| 3Q16 | $60 | 55.6 | 1,417 |
| 4Q16 | $67 | 61.7 | 1,674 |
| 1Q17 | $67 | 66.7 | 1,716 |
| 2Q17 | $66 | 68.2 | 1,709 |
| 3Q17 | $67 | 65.5 | 1,800 |
| 4Q17 | $64 | 62.2 | 1,800 |
| 1Q18 | $64 | 70.3 | 1,900 |
| 2Q18 | $68 | 87.5 | 2,200 |
| 3Q18 | $70.5 | 87.4 | 2,400 |
| 4Q18 |
$72 | 92.9 | 2,500 |
| 1Q19 | $70 | 98.8 | 2,500 |
| 2Q19 |
$68 |
87.4 |
2,400 |
Seagate vs. WD for 2FQ19
(revenue and net income in $ million, units in million)
| Seagate | WD | % in favor of WD |
|
| Revenue | 2,715 | 4,233 | 56% |
| Net income | 384 | (487) | NA |
| HDD shipped | 36.4 | 30.2 | -17% |
| Average GB/drive | 2,400 | 2,513* | 5% |
| Exabytes shipped | 87.4 | 75.9* | -13% |
| HDD ASP | $68 | $67 | -1% |
*Estimation


 Subscribe to our free daily newsletter

