


Sphere 3D: Fiscal 3Q18 Financial Results
In deep trouble, all figures down
This is a Press Release edited by StorageNewsletter.com on November 8, 2018 at 2:27 pm
Jump right to comments
| (in $ million) | 3Q17 | 3Q18 | 9 mo. 17 | 9 mo. 18 |
| Revenue | 21.7 | 15.9 | 62.9 | 53.8 |
| Growth | -27% | -14% | ||
| Net income (loss) | (3.5) | (4.9) | (18.8) | (17.7) |
Sphere 3D Corp. reported financial results for its third quarter ended September 30, 2018.
Third Quarter 2018 Financial Results:
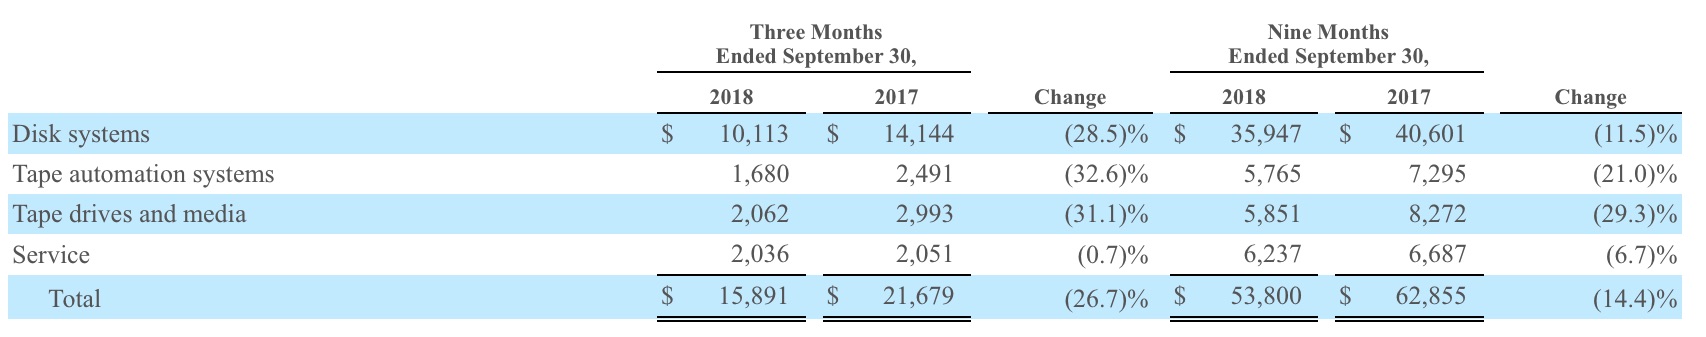
- Net revenue was $15.9 million, compared to $21.7 million for the third quarter of 2017.
- Product revenue was $13.9 million, compared to $19.6 million for the third quarter of 2017. The overall decrease in product revenue is primarily due to an increase of approximately $5.7 million of backlog at the end of the third quarter of 2018 compared with the third quarter of 2017 primarily due to the inability to acquire, on a timely basis, adequate supply of product to meet customer demand within the quarter.
- Disk systems revenue was $10.1 million, compared to $14.1 million for the third quarter of 2017. Disk systems is defined as RDX, SnapServer family, VDI, and Glassware derived products.
- Tape archive product revenue was $3.8 million compared to $5.5 million for the third quarter of 2017.
- Service revenue was $2.0 million for the third quarter of 2018 compared to $2.1 million for the third quarter of 2017.
- Gross margin was 30.4%, compared to 31.1% for the third quarter of 2017. Non-GAAP gross margin for the third quarter of 2018 was 33.9%, compared to 33.7% for the third quarter of 2017.
- Operating expenses were $7.7 million, compared to $11.2 million for the third quarter of 2017.
- Share-based compensation expense was $0.3 million, compared to $2.0 million for the third quarter of 2017. Depreciation and amortization was $0.9 million, compared to $1.5 million for the third quarter of 2017.
- Adjusted EBITDA was a net loss of $1.8 million, or a net loss of $0.95 per share, based on 1.9 million weighted average shares outstanding, compared to adjusted EBITDA net loss of $0.6 million, or a net loss of $0.85 per share, based on 0.7 million weighted average shares outstanding for the third quarter of 2017. Adjusted EBITDA is a non-GAAP measure presented as net loss before interest expense, income taxes, depreciation and amortization, share-based compensation, and warrant revaluation gain.
- Net loss was $4.9 million, or a net loss of $2.53 per share, compared to a net loss of $3.5 million, or a net loss of $4.72 per share, for the third quarter of 2017.
Nine Months Ended September 30, 2018 Financial Results:
- Net revenue was $53.8 million, compared to $62.9 million for the first nine months of 2017.
- Product revenue was $47.6 million, compared to $56.2 million for the first nine months of 2017. The overall decrease in product revenue is primarily due to an increase of approximately $5.7 million of backlog at the end of the third quarter of 2018 compared with the third quarter of 2017 primarily due to the inability to acquire, on a timely basis, adequate supply of product to meet customer demand within the quarter.
- Disk systems revenue was $35.9 million, compared to $40.6 million for the first nine months of 2017. Disk systems is defined as RDX, SnapServer family, VDI, and Glassware derived products.
- Tape archive product revenue was $11.7 million compared to $15.6 million for the first nine months of 2017.
- Service revenue was $6.2 million compared to $6.7 million for the first nine months of 2017.
- Gross margin was 30.8%, compared to 30.2% for the first nine months of 2017. Non-GAAP gross margin was 33.9%, compared to 32.9% for the first nine months of 2017.
- Operating expenses were $27.9 million, compared to $34.3 million for the first nine months of 2017.
- Share-based compensation expense was $1.5 million, compared to $5.6 million for the first nine months of 2017. Depreciation and amortization was $3.3 million for the first nine months of 2018, compared to $4.6 million for the first nine months of 2017.
- Adjusted EBITDA was a net loss of $7.0 million, or a net loss of $4.58 per share, based on 1.5 million weighted average shares outstanding, compared to adjusted EBITDA net loss of $4.2 million, or a net loss of $7.70 per share, based on 0.6 million weighted average shares outstanding for the first nine months of 2017. Adjusted EBITDA is a non-GAAP measure presented as net loss before interest expense, income taxes, acquisition costs, depreciation and amortization, share-based compensation, loss on revaluation of investment, and warrant revaluation gain.
- Net loss was $17.7 million, or a net loss of $11.55 per share, compared to a net loss of $18.8 million, or a net loss of $34.19 per share, for the first nine months of 2017.
Comments
Revenue is down 27% Y/Y and 14% Q/Q and net loss continuing to increase.
Click to enlarge
Share this news :


 Subscribe to our free daily newsletter

