


Seagate: Fiscal 1Q19 Financial Results
Shipped 4% more HDDs than Western Digital for same three-month period
This is a Press Release edited by StorageNewsletter.com on November 5, 2018 at 2:29 pm| (in $ million) | 1Q18 | 1Q19 | Growth |
| Revenue |
2,632 | 2,991 | 14% |
| Net income (loss) | 181 | 450 |
Seagate Technology plc reported financial results for the quarter ended September 28, 2018.
“In the September quarter, we achieved strong financial results in revenue, profitability and cash flow, reflecting solid execution and positive demand for our products across multiple markets. By delivering competitive cost-effective mass storage solutions, Seagate is a crucial supplier in supporting the Data Age digital transformations that are happening across the storage marketplace. We believe our deep storage industry expertise, leading technology portfolio and focused execution will continue to drive long-term success for the company and deliver value to our shareholders,” said Dave Mosley, CEO.
In the first quarter, the company generated $587 million in cash flow from operations and $410 million in free cash flow, paid cash dividends of $181 million and repurchased 3 million ordinary shares for $150 million. Cash and cash equivalents totaled $1.9 billion at the end of the quarter.
Quarterly Cash Dividend
The board of directors approved a quarterly cash dividend of $0.63 per share, which will be payable on January 2, 2019 to shareholders of record as of the close of business on December 19, 2018.
Comments
For the September quarter, Seagate delivered 14% Y/Y revenue growth (6% Q/Q), 78% yearly in non-GAAP net income, and 148% Y/Y in cash flow from operations.
It shipped 4% more HDDs than Western Digital for same three-month period. It was not the case for the former quarter.
The two companies are competing since several months to be the number one WW HDD manufacturer, in front of Toshiba with 24% for 3Q18 according to Trendfocus.
Seagate's HDD revenue was up 17% year over year.
For the enterprise market, it shipped 45.5EB, up 67% Y/Y. In the nearline market, 42.5EB were sold, and the average capacity per drive exceeded 7TB, up 30% over last year and up 52% from the September quarter two years ago. The company saw stronger than expected demand for it mission-critical portfolio that resulted in 42% year-over-year exabyte growth, with average capacity per drive over 1TB. 10TB nearline product continues to be the leading enterprise revenue SKU for Seagate, and the company achieved significant sequential volume and revenue growth in its 12TB nearline product. Highest capacity 14TB HDDs also started shipping this quarter.
Dave Mosley, CEO, said: "Relative to cloud demand, recall that in FY18, the HDD industry experienced strong growth in enterprise mass storage product demand, with nearly HDD exabyte growth of over 60% year-over-year, well above the 5% average compound annual growth rate of 35% to 40%. For Seagate, specifically, these demand disruptions fall in the middle of numerous product transitions with customers for our 12TB and 14TB nearline products, where we have not executed as crisply as we would have wanted."
In its mature markets, the firm minimizes its exposure to the sub-1TB client, consumer and mission-critical 15,000rpm markets, as it believes these application workloads will move over time to either silicon-based memory or cloud storage. In the September quarter, these products represented less than 6% of consolidated revenue. We didn't find any of these fast drives on WD' web site anymore, but only on HGST web site.
Global HDD shipments reach 98.8EB, up 41% year-over-year, 6% Q/Q. It was 106.5EB for WD for the same period.
Outside of HDDs, sales of enterprise systems, flash continue to be low other since two years. Non-HDD revenue in the September quarter were $190 million, down 21% Y/Y. The decrease was primarily due to the planned end of life of some legacy OEM cloud system products and some intra-quarter supply chain challenges where the company could not meet demand for some products. Silicon revenues were up 38% year over year and 26% sequentially.
Mosley comments: "In the September quarter, we delivered strong sequential revenue growth and began qualifying and shipping selected products with TMC NAND. Along with the rest of the market, we have increased caution over the near-term pricing environment and we are taking some defensive measures."
Expectations
For next quarter revenue is expected to be in the range of $2.70 to $2.75 billion or between -10% and -8%.
Gross margins for the December quarter is supposed to be at the low end of company's 29% to 33% long-term range, primarily reflecting the lower demand for nearline HDDs.
Seagate is scheduled to deliver 16TB capacity solutions for the nearline market in the first half of calendar 2019 using conventional magnetic recording.
It has already produced 16TB drives using HAMR, technology and expect to ship samples for evaluation in early calendar 2019, and then grow beyond 20TB per drive in calendar 2020.
Seagate anticipates nearline HDD demand will decline sequentially from 1F19 due to immediate drops in demand with most of the cloud service providers and given some uncertainty in the China enterprise marketplace.
Non-HDD revenue is forecast to be relatively flat Q/Q for systems, and SSD sales is supposed to be up double digits.
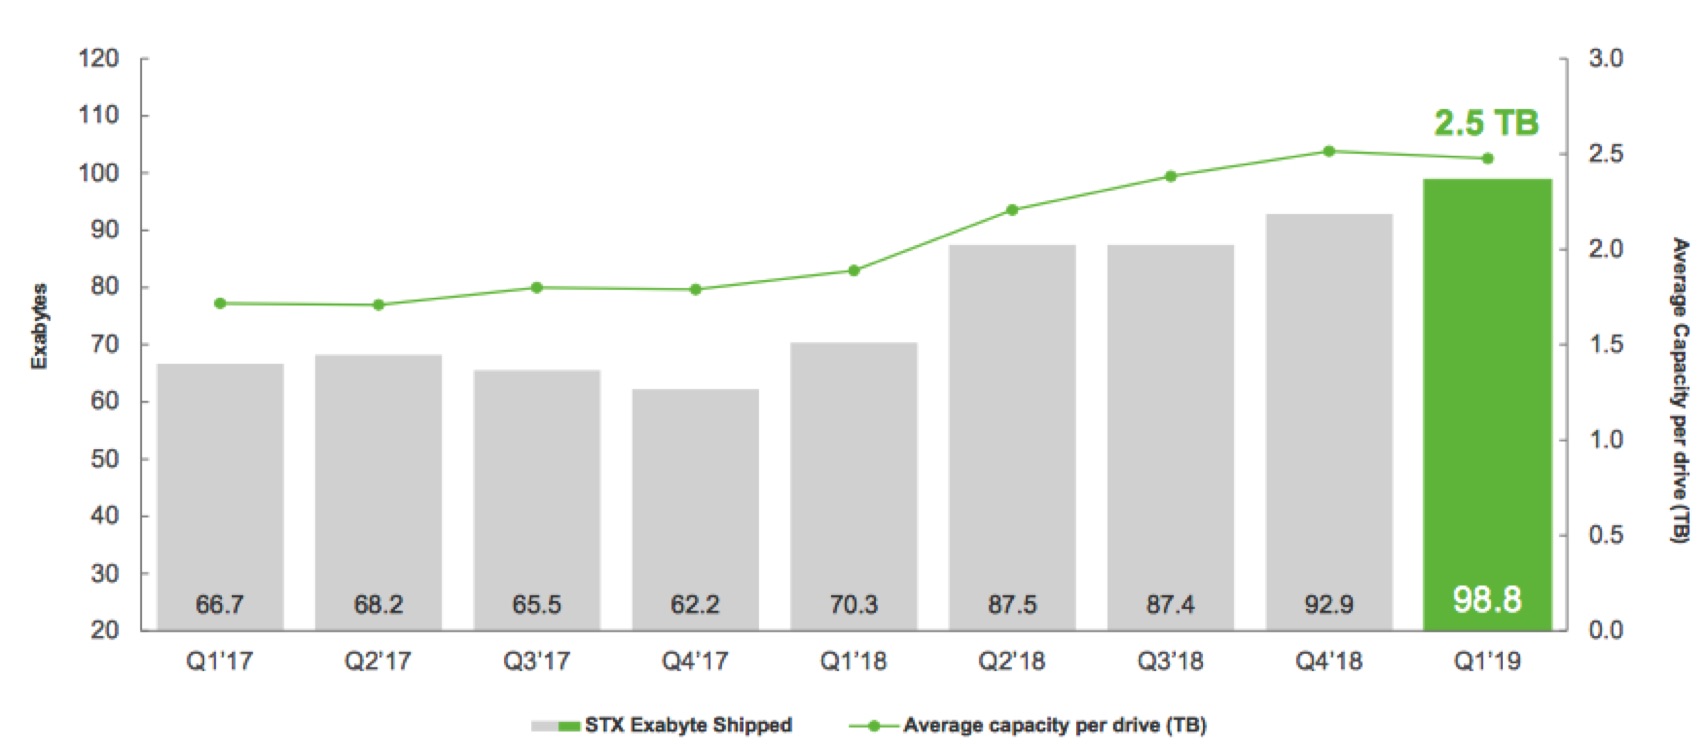
HDD exabytes shipped and average capacity per drive
Click to enlarge
HDD mix trends
(units in million)
| 4FQ18 | 1FQ19 | |
| EB enterprise mission critical | 2.5 | 3.0 |
| EB enterprise nearline | 44.5 | 42.5 |
| EB client non-compute consumer electronics | 18.2 | 23.4 |
| EB client non-compute consumer | 9.5 | 11.2 |
| EB client compute, desktop+notebook | 18.0 | 18.7 |
| Enterprise as % of total revenue | 46% | 42% |
| Client non-compute as % of total revenue | 27% | 31% |
| Client compute as % of total revenue | 21% | 20% |
Revenue by products in $ million
| 4FQ18 | 1FQ19 | Q/Q Growth | % of total revenue in 4FQ18 |
|
| HDDs | 2,652 | 2,801 | 6% | 94% |
| Enterprise systems, flash and others |
183 | 190 | 4% | 6% |
Seagate's HDDs from 2FQ15 to 1FQ19
| Fiscal period |
HDD ASP |
Exabytes | Average |
| shipped | GB/drive | ||
| 2Q15 | $61 | 61.3 | 1,077 |
| 3Q15 | $62 | 55.2 | 1,102 |
| 4Q15 | $60 | 52.0 | 1,148 |
| 1Q16 | $58 | 55.6 | 1,176 |
| 2Q16 | $59 | 60.6 | 1,320 |
| 3Q16 | $60 | 55.6 | 1,417 |
| 4Q16 | $67 | 61.7 | 1,674 |
| 1Q17 | $67 | 66.7 | 1,716 |
| 2Q17 | $66 | 68.2 | 1,709 |
| 3Q17 | $67 | 65.5 | 1,800 |
| 4Q17 | $64 | 62.2 | 1,800 |
| 1Q18 | $64 | 70.3 | 1,900 |
| 2Q18 | $68 | 87.5 | 2,200 |
| 3Q18 | $70.5 | 87.4 | 2,400 |
| 4Q18 |
$72 | 92.9 | 2,500 |
| 1Q19 |
$70 | 98.8 |
2,500 |
Seagate vs. WD for 1FQ19
(revenue and net income in $ million, units in million)
| Seagate | WD | % in favor of WD |
|
| Revenue | 2,991 | 5,028 | 68% |
| Net income | 450 | 511 | 14% |
| HDD shipped | 39.5 | 34.1 | -4% |
| Average GB/drive | 2,500 | NA | NA |
| Exabytes shipped | 98.8 | 106.5 | 3% |
| HDD ASP | $70 | $72 | 8% |
To read the earnings call transcript


 Subscribe to our free daily newsletter

