


Micron: Fiscal 4Q18 Financial Results
With FY revenue of $30 billion, continues to be largely number one worldwide storage company.
This is a Press Release edited by StorageNewsletter.com on September 24, 2018 at 2:17 pm| (in $ million) | 4Q17 | 4Q18 | FY17 | FY18 |
| Revenue | 6,138 | 8,440 | 20,322 | 30,391 |
| Growth | 38% | 50% | ||
| Net income (loss) | 2,368 | 4,325 | 5,089 | 14,135 |
Micron Technology, Inc. announced results of operations for its fourth quarter and full year of fiscal 2018, which ended August 30, 2018.
Fiscal Q4 2018 highlights
• Revenues of $8.44 billion, up 38% compared with the same period last year
• GAAP net income of $4.33 billion, or $3.56 per diluted share
• Non-GAAP net income of $4.31 billion, or $3.53 per diluted share
• Operating cash flow of $5.16 billion, compared with $3.20 billion for the same period last year
Fiscal 2018 highlights
• Revenues of $30.39 billion, up 50% compared with the prior fiscal year
• GAAP net income of $14.14 billion, or $11.51 per diluted share
• Non-GAAP net income of $14.70 billion, or $11.95 per diluted share
• Operating cash flow of $17.40 billion, compared with $8.15 billion for the prior fiscal year
“Micron delivered an exceptional fourth quarter and capped record fiscal year results by becoming the second largest semiconductor company in the U.S.,” said Sanjay Mehrotra, president and CEO. “In the fourth quarter, we set revenue records across all our major markets, from automotive and industrial to mobile and cloud datacenters. The secular and diversified growth drivers in our industry combined with accelerating pace of transformation of the new Micron form a tremendous catalyst for us to create enduring value for our customers and investors in 2019 and the years ahead.”
Revenues for the fourth quarter of 2018 were 8% higher compared to the third quarter of 2018, reflecting increased demand broadly across our products and end markets. Overall gross margin was 61.0% for the fourth quarter of 2018 compared to 60.6% in the third quarter benefiting from strong execution across our product portfolio.
Investments in capital expenditures, net of amounts funded by partners, were $2.06 billion for the fourth quarter of 2018 and $8.20 billion for the full year of 2018, which resulted in adjusted free cash flows of $3.09 billion for the fourth quarter of 2018 and $9.20 billion for the full year of 2018.
The company repurchased or converted $2.23 billion principal amount of our debt during the quarter and $6.96 billion for the full year of 2018, lowering our total carrying value of debt to $4.64 billion exiting the fiscal year.
It ended the fourth quarter in a record net cash position of $2.72 billion with cash, marketable investments, and restricted cash of $7.36 billion.
Comments
Micron, with $8.44 billion quarterly revenue, tops consensus analyst estimates of $8.25 billion.
It beats records in revenue, gross margin, free cash flow and EPS for the quarter.
It generates $5.2 billion in cash from operations, representing 61% of its revenue being up 38% Y/Y and 8% Q/Q.
For FY the figures are also impressive: sales of $30.4 billion up 50% compared to the former year with $14.1 billion net income representing 47% of global revenue.
Micron ended FY18 as the second largest semiconductor company in the U.S. behind Intel that announced guidance of more than twice more ($69.5 billion) for FY18 ending next December, but mainly with processors and much less than Micron in storage only. Intel's non-volatile memory solutions group reaches $1.1 billion for last known financial quarter.
With FY revenue of $30 billion, Micron will continue to be largely number one worldwide storage company in 2018.
Top 3 storage companies in the world
| Ranking | Company | Main business |
FY ended | Revenue* | Y/Y growth | Net income* |
| 1 | Micron | DRAM and flash | August | 30,391 | 50% | 14,135 |
| 2 | WDC | HDD and flash | June | 20,647 | 8% | 675 |
| 3 | Seagate | HDD and flash | June | 11,184 | 4% | 772 |
* in $million
Micron 4FQ18 revenue by business (in $billion)
| Business | Revenue | Q/Q growth | Y/Y growth |
| Compute and Networking | 4.4 | 9% | 53% |
| Mobile | 1.9 | 8% | 60% |
| Embedded | 0.9 | 3% | 12% |
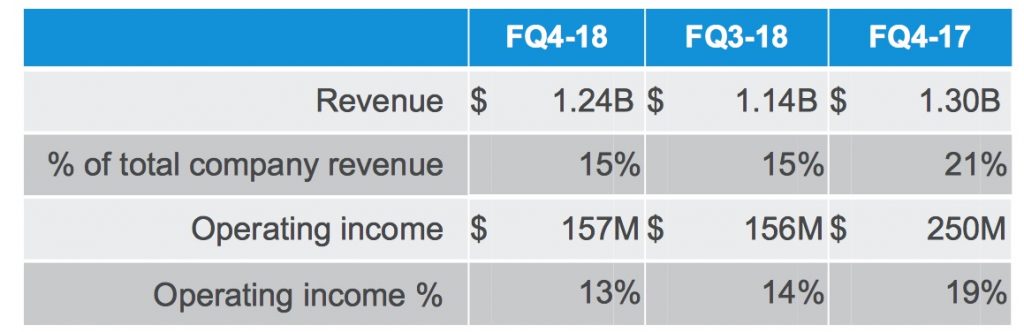
| Storage | 1.2 | 9% | -4% |
| TOTAL | 8.4 | 8% | 38% |
Storage Business Unit
NAND
Sanjay Mehrotra, president and CEO, comments on NAND business: "In NAND, cost reductions and mix improvements have helped us deliver sequential gross margin expansion, even as pricing declined in the industry. At this time last year, our bit output share was meaningfully below our wafer market share. Over the last 12 months, through the strong execution of our 64-layer ramp and a higher mix of TLC, we have reversed this trend and now have our bit share ahead of our wafer share. We remain on track to move 96-layer NAND into production this calendar year and will continue to ramp it next year, which should provide us with solid cost reductions in FY19. We have already commercialized CMOS under the array, QLC, and array stacking on 3D NAND, while most competitors still have these challenges ahead of them. Our technology leadership positions us well for the year ahead, and we are pleased with the headway we are making on our fourth-generation 3D NAND technology, which uses a replacement gate architecture."
He added: "Looking at the industry broadly, calendar 2018 has been a phenomenal year so far, with the total DRAM and NAND TAM on track to reach record highs, and total industry revenues forecasted to grow 29% year-over-year to $168 billion. (...) NAND industry bit output growth is tracking close to 45% in calendar 2018, and we expect to grow roughly in line with the industry. (...) We have seen an acceleration in (NAND) supply growth in calendar 2018, driven by the ramp of highly efficient 64-layer 3D NAND across the industry. Looking ahead, we expect a moderation in supply growth beginning in the first half of calendar 2019 as the industry transitions to more challenging 96-layer designs, which provide less benefit node-over-node."
For Dave Zinsner, SVP and CFO: "Trade NAND revenue represented 26% of total company revenue in 4FQ18. Trade NAND revenue was up 15% Q/Q and 21% Y/Y, driven by strong sequential growth in managed NAND products. Our overall NAND ASP decreased in the mid-teens percentage range and shipment quantities increased in the mid-30% percentage range compared to the prior quarter. Trade NAND gross margins were 48%, up 50 basis points from the prior quarter and up 720 basis points from the year-ago quarter, driven by robust cost reductions and product mix improvements."
SSDs
The company records 4FQ18 revenue in SSDs with enterprise and cloud revenue doubling Y/Y, driven by SATA SSDs. Trendfocus estimates that its SSD market share in number of units was 9.2% in 2Q18, behind Samsung, WDC, Toshiba, SK Hynix in order.
Mehrotra stated: "We also made excellent progress increasing our mix of higher-value-added solutions, delivering record revenue in our SSD and multi-chip package products this quarter. Our enterprise and cloud SSD quarterly revenues more than doubled year-over-year as we strengthened our position in SATA SSDs. A third-party research firm recently recognized Micron as the number one market share leader in enterprise SATA SSDs. We achieved well over $2 billion in annual SSD revenue in FY18. (...) Our first-generation NVMe SSD is in the final stages of product development. Looking ahead, we are focused on introducing new NVMe SSDs over the course of the next several quarters. Consumer and client NVMe SSDs will come first, and then, late in calendar 2019, cloud and enterprise NVMe drives. As the market rapidly shifts to NVMe, 2019 will be a year of transition for us following solid SSD share gains in 2018, and we expect to start growing SSD share again in 2020 with a fuller product portfolio. We also look forward to leveraging our market advantage with QLC SSDs in 2019 and beyond."
For next quarter, Micron expects revenue decreasing between $7.90 million and $8.30 million down between 7% and 2%.
To read the earnings call transcript
Read also:
Micron: Fiscal 4Q17 Financial Results
Difficult to do better
2017.09.28 | Press Release | [with our comments]


 Subscribe to our free daily newsletter


