


Sphere 3D: Fiscal 2Q18 Financial Results
Out of money, disk systems revenue up, tape archive sales down
This is a Press Release edited by StorageNewsletter.com on August 16, 2018 at 2:24 pm| (in $ million) | 2Q17 | 2Q18 | 6 mo. 17 | 6 mo. 18 |
| Revenue | 19.4 | 18.5 | 41.2 | 37.9 |
| Growth | -5% | -8% | ||
| Net income (loss) | (7.5) | (6.0) | (15.3) | 12.8 |
Sphere 3D Corp. reported financial results for its second quarter ended June 30, 2018.
Second Quarter 2018 Financial Results:
• Net revenue for the second quarter of 2018 was $18.5 million, compared to $19.4 million for the second quarter of 2017.
• Product revenue for the second quarter of 2018 was $16.3 million, compared to $17.1 million for the second quarter of 2017.
- Disk systems revenue was $12.7 million, compared to $11.5 million for the second quarter of 2017. Disk systems is defined as RDX, SnapServer family, VDI, and Glassware derived products.
- Tape archive product revenue was $3.6 million compared to $5.6 million for the second quarter of 2017.
• Service revenue was $2.2 million in the second quarter of 2018 compared to $2.3 million for the second quarter of 2017.
• Gross margin for the second quarter of 2018 was 31.0%, compared to 27.7% for the second quarter of 2017. Non-GAAP gross margin for the second quarter of 2018 was 34.0%, compared to 30.6% for the second quarter of 2017.
• Operating expenses for the second quarter of 2018 were $9.1 million, compared to $11.5 million for the second quarter of 2017.
• Share-based compensation expense for the second quarter of 2018 was $0.4 million, compared to $1.5 million for the second quarter of 2017. Depreciation and amortization was $0.9 million in the second quarter of 2018, compared to $1.5 million for the second quarter of 2017.
• Adjusted EBITDA for the second quarter of 2018 was a net loss of $1.9 million, or a net loss of $0.14 per share, based on 13.7 million weighted average shares outstanding, compared to adjusted EBITDA net loss of $2.6 million, or a net loss of $0.64 per share, based on 4.1 million weighted average shares outstanding for the second quarter of 2017. Adjusted EBITDA is a non-GAAP measure presented as net loss before interest expense, income taxes, acquisition costs, depreciation and amortization, share-based compensation, loss on revaluation of investment, and warrant revaluation gain.
• Net loss for the second quarter of 2018 was $6.0 million, or a net loss of $0.44 per share, compared to a net loss of $7.5 million, or a net loss of $1.81 per share, in the second quarter of 2017.
Six Months Ended June 30, 2018 Financial Results:
• Net revenue for the first six months of 2018 was $37.9 million, compared to $41.2 million for the first six months of 2017.
• Product revenue for the first six months of 2018 was $33.7 million, compared to $36.5 million for the first six months of 2017.
- Disk systems revenue was $25.8 million, compared to $26.5 million for the first six months of 2017. Disk systems is defined as RDX, SnapServer family, VDI, and Glassware derived products.
- Tape archive product revenue was $7.9 million compared to $10.0 million for the first six months of 2017.
Click to enlarge
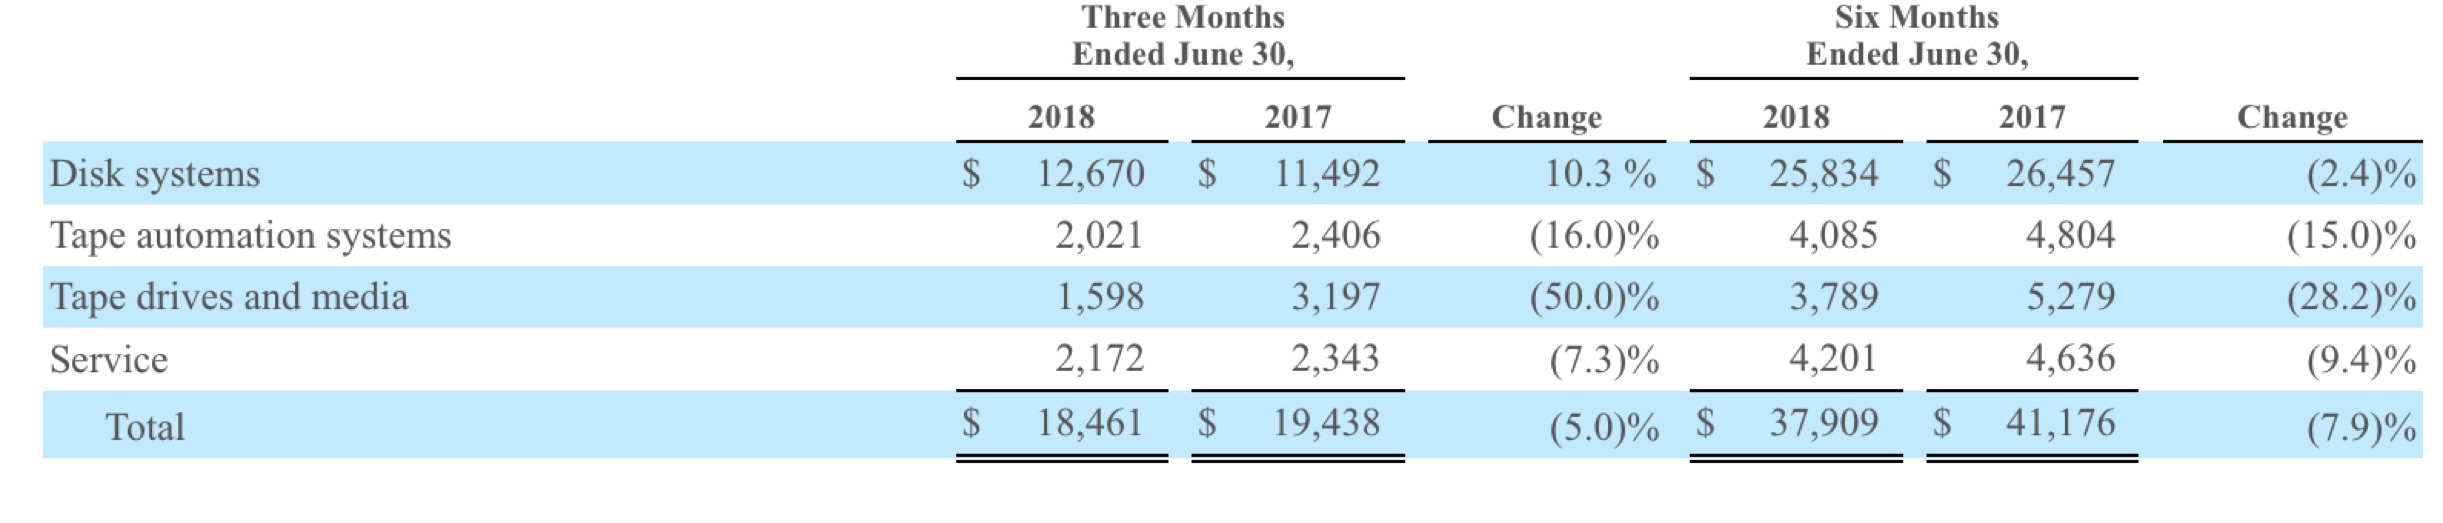 • Service revenue was $4.2 million in the first six months of 2018 compared to $4.6 million for the first six months of 2017.
• Gross margin for the first six months of 2018 was 30.9%, compared to 29.7% for the first six months of 2017. Non-GAAP gross margin for the first six months of 2018 was 33.9%, compared to 32.4% for the first six months of 2017.
• Operating expenses for the first six months of 2018 were $20.2 million, compared to $23.1 million for the first six months of 2017.
• Share-based compensation expense for the first six months of 2018 was $1.3 million, compared to $3.7 million for the first six months of 2017. Depreciation and amortization was $2.4 million in the first six months of 2018, compared to $3.1 million for the first six months of 2017.
• Adjusted EBITDA for the first six months of 2018 was a net loss of $5.2 million, or a net loss of $0.49 per share, based on 10.7 million weighted average shares outstanding, compared to adjusted EBITDA net loss of $3.6 million, or a net loss of $0.99 per share, based on 3.6 million weighted average shares outstanding for the first six months of 2017. Adjusted EBITDA is a non-GAAP measure presented as net loss before interest expense, income taxes, acquisition costs, depreciation and amortization, share-based compensation, loss on revaluation of investment, and warrant revaluation gain.
• Net loss for the first six months of 2018 was $12.8 million, or a net loss of $1.20 per share, compared to a net loss of $15.3 million, or a net loss of $4.22 per share, in the first six months of 2017.


 Subscribe to our free daily newsletter

