


Seagate: Fiscal 4Q18 Financial Results
Revenue up 4% in FY18, 1% Q/Q and 18% Y/Y for more recent quarter
This is a Press Release edited by StorageNewsletter.com on July 31, 2018 at 3:28 pm| (in $ million) | 4Q17 | 4Q18 | FY17 | FY18 |
| Revenue | 2,406 | 2,835 | 10,771 | 11,184 |
| Growth | 18% | 4% | ||
| Net income (loss) | 114 | 461 | 1,182 | 772 |
Seagate Technology plc reported financial results for the quarter and fiscal year ended June 29, 2018.
For the fourth quarter, the company reported revenue of $2.8 billion, gross margin of 31.9%, net income of $461 million and diluted earnings per share of $1.57.
On a non-GAAP basis, which excludes the net impact of certain items, Seagate reported gross margin of 32.4%, net income of $475 million and diluted earnings per share of $1.62.
During the fourth quarter, the company generated $468 million in cash flow from operations and $372 million in free cash flow.
For the fiscal year ended June 29, 2018, the company reported revenue of $11.2 billion, gross margin of 30.1%, net income of $1.2 billion and diluted earnings per share of $4.05. On a non-GAAP basis, it reported gross margin of 30.7%, net income of $1.6 billion and diluted earnings per share of $5.51.
In fiscal year 2018, the company generated approximately $2.1 billion in cash flow from operations and $1.7 billion in free cash flow, paid cash dividends of $726 million and repurchased 10 million ordinary shares for $361 million.
Firm’s’ balance sheet remains healthy and during the fiscal year the company repurchased $214 million of outstanding debt and invested approximately $1.3 billion, as part of a consortium led by Bain Capital Private Equity, in the acquisition of Toshiba Memory Corporation.
Cash and cash equivalents totaled approximately $1.9 billion at the end of the fiscal year.
There were 287 million ordinary shares issued and outstanding as of the end of the fiscal year.
“We achieved our third consecutive quarter of year-over-year revenue growth and exceeded our financial performance expectations for both the June quarter and this fiscal year. Seagate’s year-over-year revenue and profitability growth results for fiscal year 2018 reflect solid execution and strong demand for our mass storage products. Looking ahead, we are confident that storage infrastructure demand will continue to grow with the Data Age digital transformations being fueled by new technologies, emerging industries and growing businesses. We believe Seagate has expanding opportunities to support the marketplace in these transformations and that we have the vision, products, technology and operational experience to ensure our long-term success and grow shareholder value,” said Dave Mosley, Seagate’s CEO.
Comments
Revenue was up 4% year-over-year in FY18, 1% Q/Q and 18% Y/Y for the more recent quarter topping estimates.
In the June quarter, HDD sales were up 19% year-over-year, but other businesses continue to decline. -16% Q/Q, and only 6% ($183 million) of global revenue for enterprise systems, flash and others. Within this, silicon revenue was up 53% Y/Y and the company is bullish about its opportunities to leverage its supply agreement with Toshiba Memory Corporation as it invests in developing a broad-based silicon product portfolio in the SaaS, NVMe, consumer and gaming markets for revenue growth and expanding margin contributions. Cloud systems revenue declined 21% Y/Y, primarily due to the planned shaping of its business to optimize the margin structure and business mix. In the June quarter as part of a consortium led by the Bain Private Equity, Seagate finalized its investment of $1.3 billion in acquisition of the Toshiba Memory Corporation. This investment is expected to have a 5% per annum financial return that is intended to be held to maturity over its 6-year life.
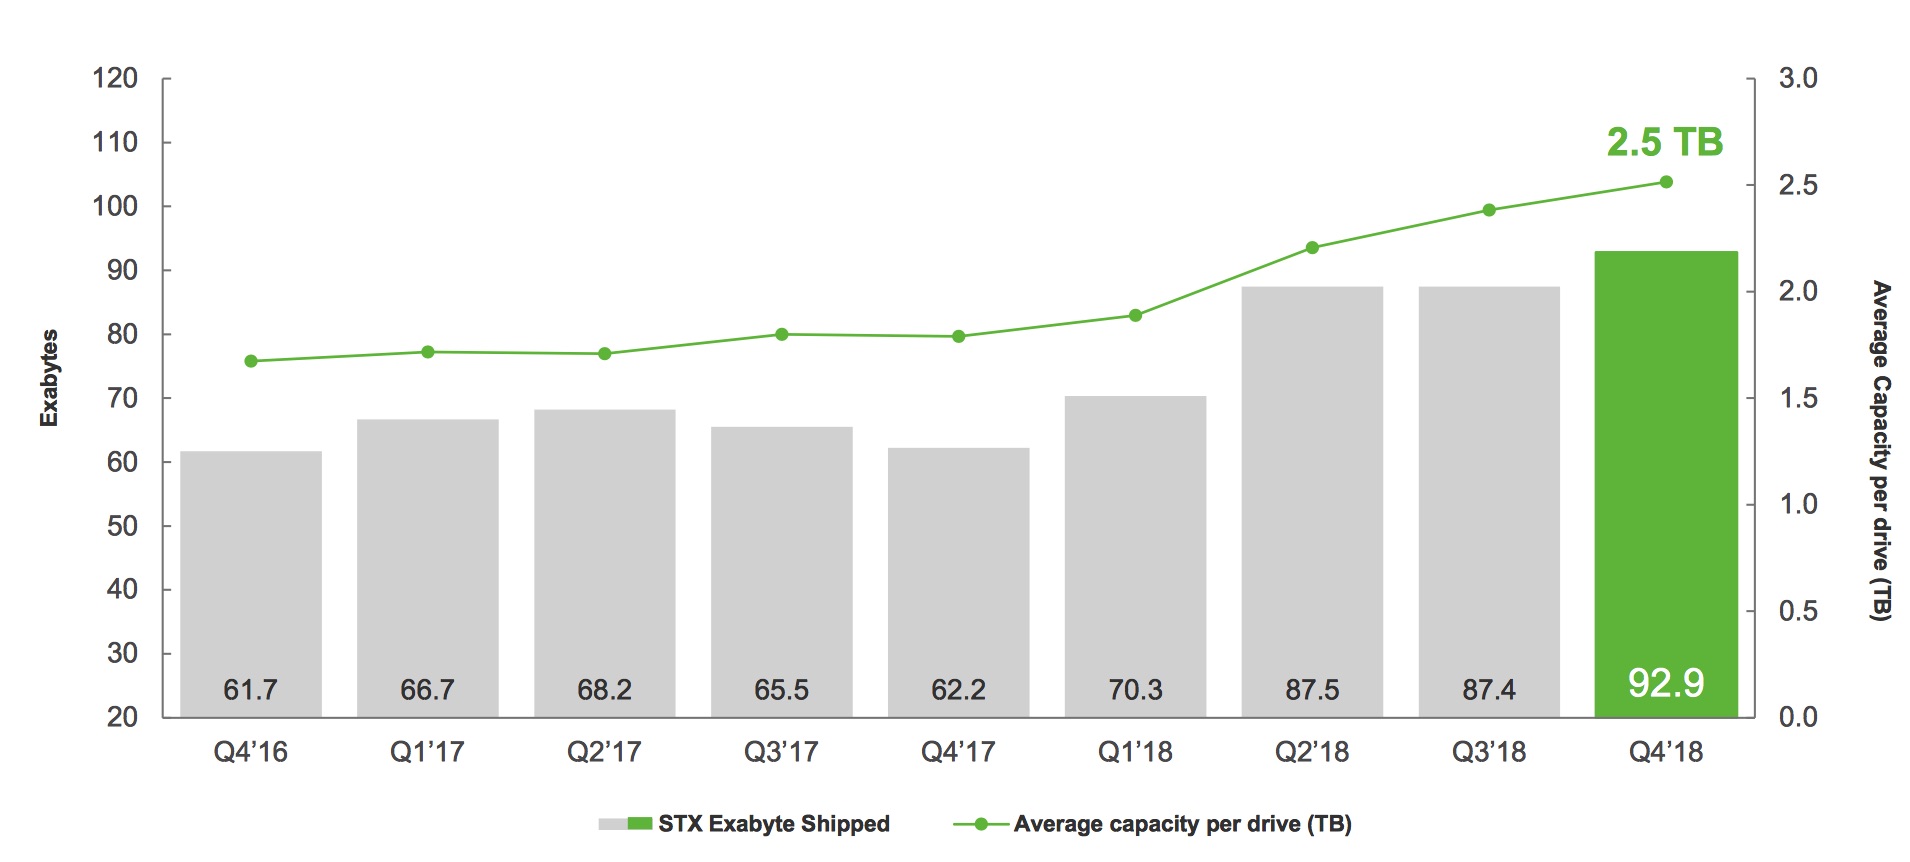
Exabyte shipments were up 29% year-over-year.
The average capacity per drive across the HDD portfolio was a record 2.5TB per drive, up 40% Y/Y and the average selling price per unit was $72, up yearly 12%.
For the enterprise HDD market, the company shipped a record 47.2EB with a record average capacity of 5.3TB per drive, up 54% year-over-year. In the nearline market, it shipped 44.5EB and average capacity per drive reached 7TB per device, up 43% over last year and up 54% from the June quarter two years ago.
10TB nearline product was the leading enterprise SKU in the June quarter and the firm achieved significant sequential volume and revenue growth in its 12TB nearline product.
Seagate expects revenue in the September quarter to be up 5% sequentially, demonstrating Y/Y revenue growth of over 10%. This rate of sequential growth should continue through the December quarter as well.
Dave H. Morton, Jr., CFO for close to three years and with the company for over 23 years, has decided to leave to become chief accounting officer at Tesla Inc. The board has appointed Kate Scolnick as interim CFO and will commence a search for Morton's successor.
He commented in the earnings call: "I wanted to provide an updated perspective on the recently enacted and proposed trade actions to increase tariffs on some products imported into the U.S., including some of Seagate storage products. In response to the tariff changes that took place this month we are actively working with our affected customers and suppliers to identify and implement minimally disruptive mitigation plans."
HDD exabytes shipped and average capacity per drive
Click to enlarge
HDD mix trends
(units in million)
| 3FQ18 | 4FQ18 | |
| EB enterprise mission critical | 2.5 | 2.6 |
| EB enterprise nearline | 41.3 | 44.5 |
| EB client non-compute consumer electronics | 14.6 | 18.2 |
| EB client non-compute consumer | 11.6 | 9.5 |
| EB client compute, desktop+notebook | 17.5 | 18.0 |
| Enterprise as % of total revenue | 44% | 46% |
| Client non-compute as % of total revenue | 26% | 27% |
| Client compute as % of total revenue | 22% | 21% |
Revenue by products in $ million
| 3FQ18 | 4FQ18 | Growth | % of total revenue in 4FQ18 |
|
| HDDs | 2,586 | 2,652 | 3% | 94% |
| Enterprise systems, flash and others |
217 | 183 | -16% | 6% |
Seagate's HDDs from 2FQ15 to 4FQ18
| Fiscal period |
HDD ASP |
Exabytes | Average |
| shipped | GB/drive | ||
| 2Q15 | $61 | 61.3 | 1,077 |
| 3Q15 | $62 | 55.2 | 1,102 |
| 4Q15 | $60 | 52.0 | 1,148 |
| 1Q16 | $58 | 55.6 | 1,176 |
| 2Q16 | $59 | 60.6 | 1,320 |
| 3Q16 | $60 | 55.6 | 1,417 |
| 4Q16 | $67 | 61.7 | 1,674 |
| 1Q17 | $67 | 66.7 | 1,716 |
| 2Q17 | $66 | 68.2 | 1,709 |
| 3Q17 | $67 | 65.5 | 1,800 |
| 4Q17 | $64 | 62.2 | 1,800 |
| 1Q18 | $64 | 70.3 | 1,900 |
| 2Q18 | $68 | 87.5 | 2,200 |
| 3Q18 | $70.5 | 87.4 | 2,400 |
| 4Q18 |
$72 |
92.9 |
2,500 |
Seagate vs. WD for 4FQ18
(revenue and net income in $ million, units in million)
| Seagate | WD | % in favor of WD |
|
| Revenue | 2,835 | 5,117 | 80% |
| Net income | 461 | 756 | 64% |
| HDD shipped | 37 | 39 | 5% |
| Average GB/drive | 2,500 | NA | NA |
| Exabytes shipped | 92.9 | 106.5 | 15% |
| HDD ASP | $72 | $70 | -3% |
To read the earnings call transcript


 Subscribe to our free daily newsletter

