


Mellanox: Fiscal 2Q18 Financial Results
Growth continuing with revenue up 27% but flat IB sales
This is a Press Release edited by StorageNewsletter.com on July 18, 2018 at 2:26 pm| (in $ million) | 2Q17 | 2Q18 | 6 mo. 17 | 6 mo. 18 |
| Revenue | 212.0 | 268.5 | 400.6 | 519.5 |
| Growth | 27% | 30% | ||
| Net income (loss) | (8.0) | 16.5 | (20.2) | 54.4 |
Mellanox Technologies, Ltd. announced financial results for its second quarter 2018 ended June 30, 2018.
“Mellanox has achieved another record financial performance in the second quarter 2018. Our strong revenue growth reflects years of investment in 25Gb/s and above Ethernet and IB technologies. Our record profitability demonstrates the leverage we are producing in the business by focusing our investments in the right products,” said Eyal Waldman, president and CEO. “We continue to see strong traction with our 25Gb/s and above solutions as they become the preferred solution of choice in hyperscale, cloud, HPC, artificial intelligence, storage, financial services and other markets across the globe. Our Ethernet revenue grew 81% year-over-year driven by network adapter and switch growth with hyperscale and OEM customers. We are proud to see our IB solutions accelerate the world’s top three and four of the top five supercomputers, as seen in the recently published TOP500 supercomputers list. Our performance in the second quarter further shows the benefit of our investment in diversifying our revenue base and the operational focus that is driving our higher profitability.”
Second Quarter 2018
- Revenue of $268.5 million, an increase of 26.7%, compared to $212.0 million in the second quarter of 2017.
- GAAP gross margins of 61.4%, compared to 65.4% in the second quarter of 2017.
- Non-GAAP gross margins of 69.1% in the second quarter, compared to 70.6% in the second quarter of 2017.
- GAAP operating income of $16.6 million, compared to operating loss of $4.4 million in the second quarter of 2017.
- Non-GAAP operating income of $66.2 million, or 24.7% of revenue, compared to $26.5 million, or 12.5% of revenue in the second quarter of 2017.
- GAAP net income of $16.5 million, compared to net loss of $8.0 million in the second quarter of 2017.
- Non-GAAP net income of $66.6 million, compared to $22.4 million in the second quarter of 2017.
- GAAP net income per diluted share of $0.30 in the second quarter, compared to net loss per diluted share of $0.16 in the second quarter of 2017.
- Non-GAAP net income per diluted share of $1.25 in the second quarter, compared to $0.44 in the second quarter of 2017.
- $46.7 million in cash provided by operating activities, compared to
- $6.4 million in the second quarter of 2017.
- Cash and investments totaled $282.6 million at June 30, 2018, compared to $273.8 million at December 31, 2017.
First Half 2018
- Revenue of $519.5 million, an increase of 29.7%, compared to $400.6 million in the first half of 2017.
- GAAP operating income of $28.5 million, compared to operating loss of $17.0 million in the first half of 2017.
- Non-GAAP operating income of $118.4 million, or 22.8% of revenue, compared to $42.1 million, or 10.5% of revenue in first half of 2017.
- GAAP benefit from taxes on income of $26.7 million, mainly due to a reversal of valuation allowance on deferred tax assets.
- GAAP net income of $54.4 million, compared to net loss of $20.2 million in the first half of 2017.
- Non-GAAP net income of $118.0 million, compared to $37.0 million in the first half of 2017.
- GAAP net income per diluted share of $1.00, compared to net loss per diluted share of $0.41 in the first half of 2017.
- Non-GAAP net income per diluted share of $2.23, compared to $0.73 in the first half of 2017.
- $102.1 million in cash provided by operating activities, compared to
- $41.4 million in the first half of 2017.
Waldman continued: “In the first half of 2018 our revenue growth has proven the value of our investments and we look forward to continuing our momentum into the second half of the year. We grew our revenue almost 30% in the first half and more than doubled our non-GAAP operating income year over year. We expect our margin expansion to continue with further revenue growth and operational efficiency. We are confident that our strategy, investments and innovation will continue to produce market-leading products that drive growth for Mellanox for the rest of 2018 and beyond.”
Third Quarter 2018 Outlook
- Quarterly revenue of $270 million to $280 million
- Non-GAAP gross margins of 68.5% to 69.5%
- Non-GAAP operating expenses of $122 million to $124 million
- Share-based compensation expense of $19.0 million to $19.5 million
- Non-GAAP diluted share count of 53.5 million to 54.0 million
Full Year 2018 Outlook
- Revenue of $1,065 million to $1,085 million
- Non-GAAP gross margins of 68.5% to 69.5%
- Non-GAAP operating margin of 23.0% to 24.0%
Comments
The company has now a long history of revenue growth: 10-year average at more than 20%.
2Q18 revenue came in near the top of firm's updated guidance at $268.5 million.
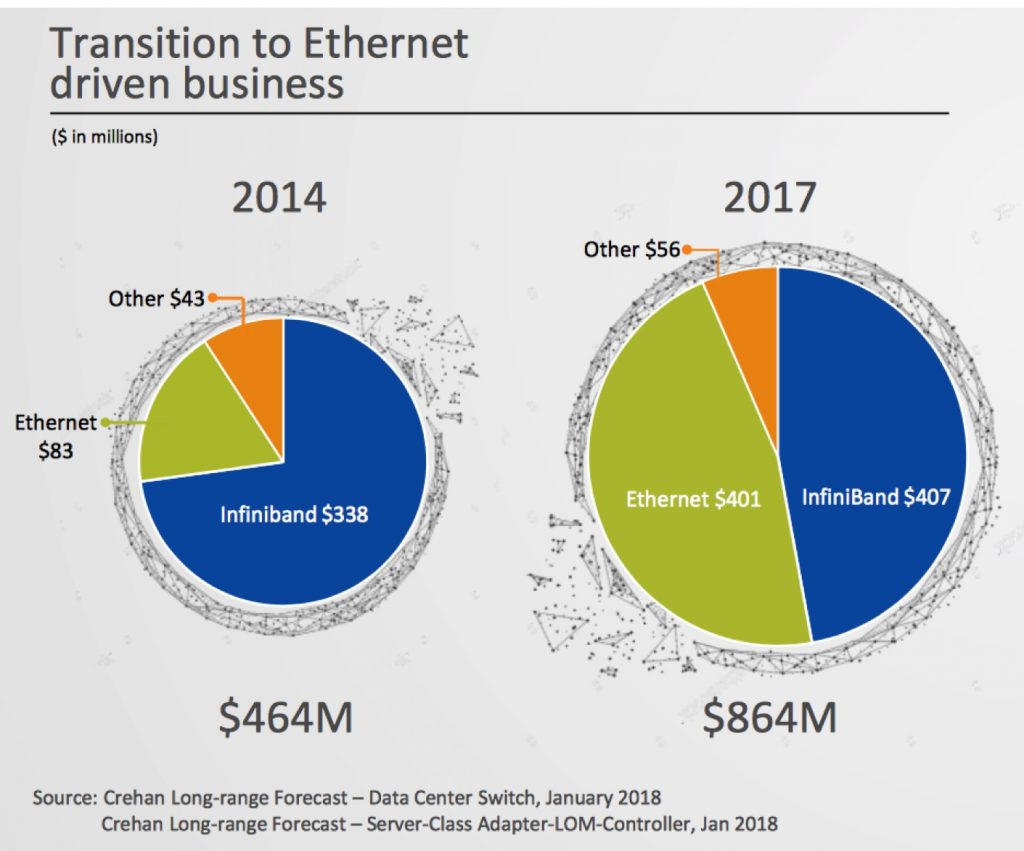
IB and Ethernet increased 13% in the six months from November 2017 to June 2018.
Mellanox connects currently 43% of TOP500 platforms (216 systems).
Revenue from ICs represented 11% of second quarter revenues. Revenue from boards were 51% and switch system revenue accounted for 21%. Second quarter IB revenue were $102.1 million.
IB sales were roughly flat sequentially and are expected also to be flat to slightly up Y/Y in 2018. But the firm remains confident IB will grow in low single-digits for the year. Revenue from IB-based products represented 38% of revenue in 2Q18 down from 41% in 1Q18. EDR 100Gb/s IB products were up 6% sequentially and flat from 2Q17 and represented 58.1% of the second quarter IB revenues.
IB growth was driven by:
- * Growth in AI/HPC (70% to 80% of business)
- * Storage back to growth
- * Ramp of 200Gb/s HDR
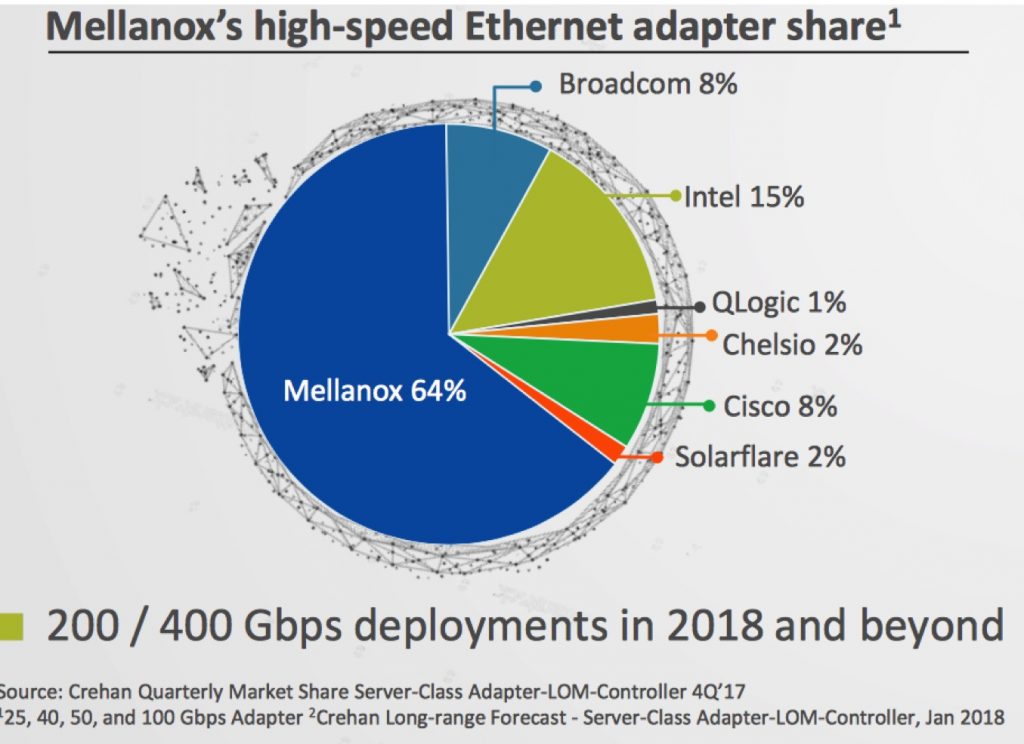
Quarterly Ethernet sales were $157.5 million, up 15% sequentially and up 81% from 2Q17 driven by increased adoption of 25Gb/s and above ConnectX network adapters, Spectrum switches and LinkX cables and consumers. They represented 59% of second quarter revenue.
Ethernet switch revenue was up 114% Y/Y.
The company had two greater than 10% customers in the second quarter: Dell EMC with 14% and HPE with 13% of revenue.
Mellanox expects revenue of $1,065 million to $1,085 million for FY18, or up 22% to 24% Y/Y.


 Subscribe to our free daily newsletter

