


Backblaze Stats for 1Q18: 98,046 HDDs Tested
10TB Seagate, 6TB WD, 5TB Toshiba and 4TB HGST units with no failures at all
This is a Press Release edited by StorageNewsletter.com on May 4, 2018 at 2:11 pm This article was written by Andy Klein, director of product marketing, Backblaze, on May 1, 2018.
HDD Stats for Q1 2018
As of March 31, 2018 we had 100,110 spinning HDDs. Of that number, there were 1,922 boot drives and 98,188 data drives. This review looks at the quarterly and lifetime statistics for the data drive models in operation in our data centers. We’ll also take a look at why we are collecting and reporting 10 new SMART attributes and take a sneak peek at some 8TB Toshiba drives. Along the way, we’ll share observations and insights on the data presented and we look forward to you doing the same in the comments.
Background
Since April 2013, Backblaze has recorded and saved daily HDD statistics from the drives in our data centers. Each entry consists of the date, manufacturer, model, serial number, status (operational or failed), and all of the SMART attributes reported by that drive. Currently there are about 97 million entries totaling 26GB of data. You can download this data from our website if you want to do your own research, but for starters here’s what we found.
HDD Reliability Statistics for 1Q18
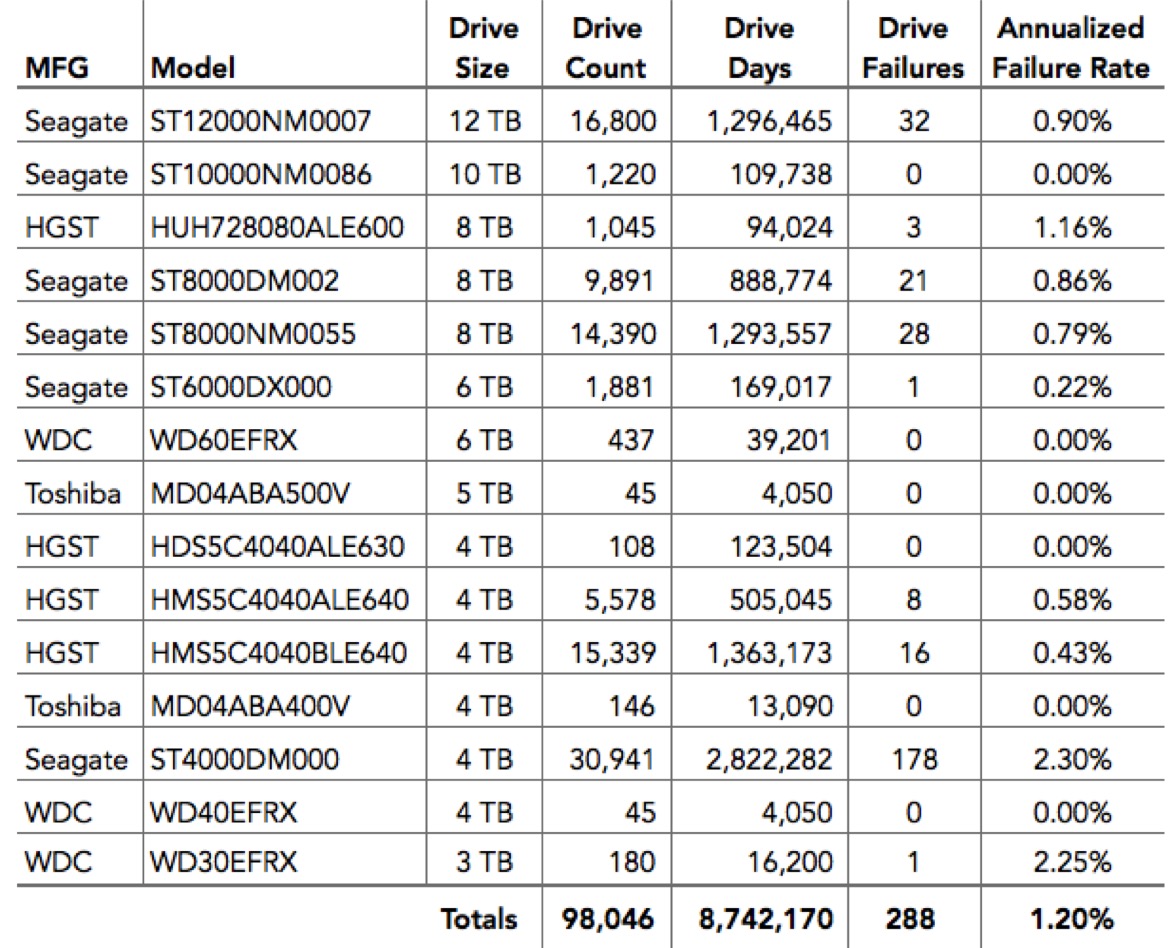
At the end of 1Q018 Backblaze was monitoring 98,188 HDDs used to store data. For our evaluation below we remove from consideration those drives which were used for testing purposes and those drive models for which we did not have at least 45 drives. This leaves us with 98,046 HDDs. The table below covers just 1Q18.
1Q18 HDD failure rates
(reporting period 1/1/2018 – 3/31/2018 inclusive)
Notes and Observations
If a drive model has a failure rate of 0%, it only means there were no drive failures of that model during 1Q18.
The overall Annualized Failure Rate (AFR) for Q1 is just 1.2%, well below the 4Q17 AFR of 1.65%. Remember that quarterly failure rates can be volatile, especially for models that have a small number of drives and/or a small number of Drive Days.
There were 142 drives (98,188 minus 98,046) that were not included in the list above because we did not have at least 45 of a given drive model. We use 45 drives of the same model as the minimum number when we report quarterly, yearly, and lifetime drive statistics.
Welcome Toshiba 8TB drives, almost…
We mentioned Toshiba 8TB drives in the first paragraph, but they don’t show up in the 1Q Stats chart. What gives? We only had 20 of the Toshiba 8TB drives in operation in Q1, so they were excluded from the chart. Why do we have only 20 drives? When we test out a new drive model we start with the ‘tome test’ and it takes 20 drives to fill one tome. A tome is the same drive model in the same logical position in each of the 20 Storage Pods that make up a Backblaze Vault. There are 60 tomes in each vault.
In this test, we created a Backblaze Vault of 8TB drives, with 59 of the tomes being Seagate 8TB drives and 1 tome being the Toshiba drives. Then we monitored the performance of the vault and its member tomes to see if, in this case, the Toshiba drives performed as expected.
1Q18 HDD failure rates – Toshiba 8TB
(reporting period 1/1/2018 – 3/31 2018 inclusive)
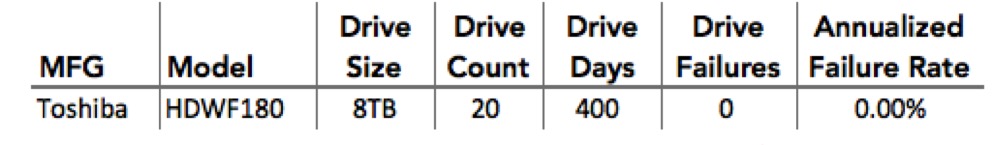
So far the Toshiba drive is performing fine, but they have been in place for only 20 days. Next up is the ‘pod test’ where we fill a Storage Pod with Toshiba drives and integrate it into a Backblaze Vault comprised of like-sized drives. We hope to have a better look at the Toshiba 8TB drives in our 2Q18 report – stay tuned.
Lifetime HDD Reliability Statistics
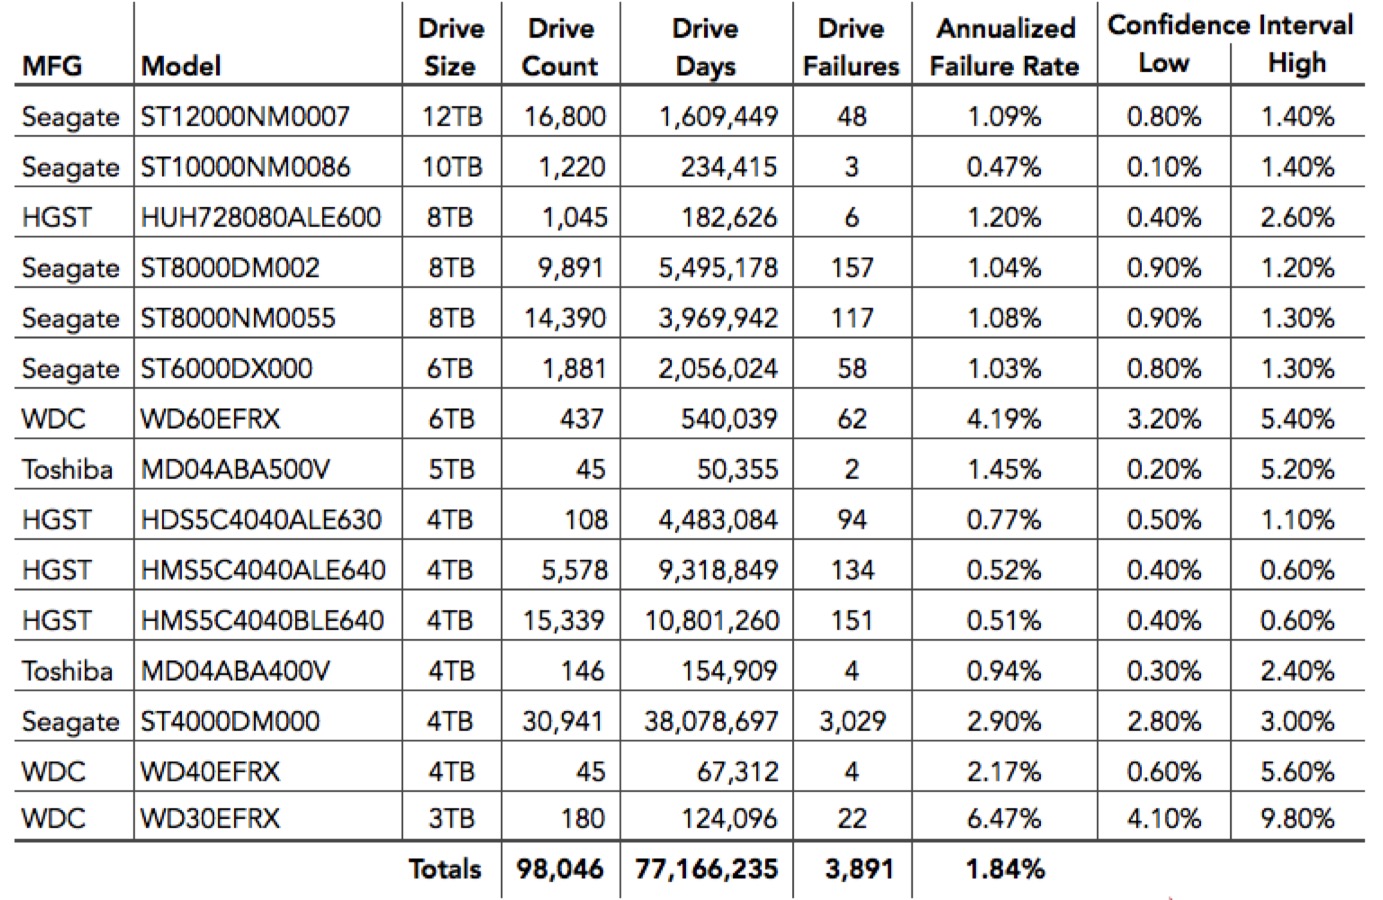
While the quarterly chart presented earlier gets a lot of interest, the real test of any drive model is over time. Below is the lifetime failure rate chart for all the HDD models which have 45 or more drives in operation as of March 31st, 2018. For each model, we compute their reliability starting from when they were first installed.
Lifetime HDD failure rates
(reporting period April 2013-March 2018 inclusive)
Notes and Observations
The failure rates of all of the larger drives (8-, 10- and 12TB) are very good, 1.2% AFR (Annualized Failure Rate) or less. Many of these drives were deployed in the last year, so there is some volatility in the data, but you can use the Confidence Interval to get a sense of the failure percentage range.
The overall failure rate of 1.84% is the lowest we have ever achieved, besting the previous low of 2.00% from the end of 2017.
Our regular readers and drive stats wonks may have noticed a sizable jump in the number of HGST 8TB drives (model: HUH728080ALE600), from 45 last quarter to 1,045 this quarter. As the 10TB and 12TB drives become more available, the price per terabyte of the 8TB drives has gone down. This presented an opportunity to purchase the HGST drives at a price in line with our budget.
We purchased and placed into service the 45 original HGST 8TB drives in 2Q15. They were our first helium-filled drives and our only ones until the 10TB and 12TB Seagate drives arrived in 3Q17. We’ll take a first look into whether or not helium makes a difference in drive failure rates in an upcoming blog post.
New SMART Attributes
If you have previously worked with the HDD stats data or plan to, you’ll notice that we added 10 more columns of data starting in 2018.
There are 5 new SMART attributes we are tracking each with a raw and normalized value:
• 177 – Wear Range Delta
• 179 – Used Reserved Block Count Total
• 181 – Program Fail Count Total or Non-4K Aligned Access Count
• 182 – Erase Fail Count
• 235 – Good Block Count AND System(Free) Block Count
The five values are all related to SSD drives.
Yes, SSD drives, but before you jump to any conclusions, we used 10 Samsung 850 EVO SSDs as boot drives for a period of time in 1Q18. This was an experiment to see if we could reduce boot up time for the Storage Pods. In our case, the improved boot up speed wasn’t worth the SSD cost, but it did add 10 new columns to the HDD stats data.
Speaking of HDD stats data, the complete data set used to create the information used in this review is available on our HDD Test Data page. You can download and use this data for free for your own purpose.
If you just want the summarized data used to create the tables and charts in this blog post, you can download the ZIP file containing the MS Excel spreadsheet.
Read also:
Most Reliable 3.5-Inch HDDs – Backblaze
Among 91,243 units tested
2018.02.19 | Press Release
Backblaze HDD Stats for 3Q17
Zero failure for 1,240 10TB and 12TB drives recently added
2017.10.31 | Press Release
2Q17 and Lifetime HDD Failure Rates at Backblaze
Annualized rates of 1,97% on 83,296 3.5-inch drives from 2013 to 2017
2017.09.13 | Press Release
Backblaze Updates Lifetime HDD Failure Rates in 1Q17
Among 17 drives, best result for HGST 4TB HMS5C4040ALE640, worst for WDC 6TB WD30EFRX
2017.05.11 | Press Release


 Subscribe to our free daily newsletter


