


Seagate: Fiscal 3Q18 Financial Results
Y/Y revenue increasing 5% Y/Y and exabyte shipment by 34%
This is a Press Release edited by StorageNewsletter.com on May 3, 2018 at 2:13 pm| (in $ million) | 3Q17 | 3Q18 | 9 mo. 17 | 9 mo. 18 |
| Revenue | 2,674 | 2,803 | 8,365 | 8,349 |
| Growth | 5% | -0% | ||
| Net income (loss) | 194 | 381 | 658 | 721 |
Seagate Technology plc reported financial results for the quarter ended March 30, 2018.
For the third quarter, the company reported revenue of $2.8 billion, gross margin of 30.2%, net income of $381 million and diluted earnings per share of $1.31.
On a non-GAAP basis, which excludes the net impact of certain items, Seagate reported gross margin of 30.8%, net income of $424 million and diluted earnings per share of $1.46.
During the third quarter, the company generated $558 million in cash flow from operations and $489 million in free cash flow. Year to date, it has generated approximately $1.6 billion in cash flow from operations and approximately $1.4 billion in free cash flow. Cash and cash equivalents totaled approximately $2.9 billion at the end of the quarter. There were 287 million ordinary shares issued and outstanding as of the end of the quarter.
“Seagate achieved our second consecutive quarter of year-over-year revenue growth and exceeded our financial performance expectations for the March quarter, through solid execution and strong demand for our mass storage products. Looking ahead, the growing Data Age demand on storage, combined with consistent investment in our leading storage technology platforms and efficient operational capabilities, will continue to drive economic value for customers and returns for shareholders,” said Dave Mosley, CEO.
The board of directors has approved a quarterly cash dividend of $0.63 per share, which will be payable on July 5, 2018 to shareholders of record as of the close of business on June 20, 2018.
Comments
Like WD for the same quarterly period, Seagate records a relatively good three-month period thanks to nearline HDDs and increasing ASPs to be profitable, despite the seasonally soft quarter of HDD demand.
In the March quarter, global revenue Y/Y was up 5% Y/Y, and HDD sales were up 7%.
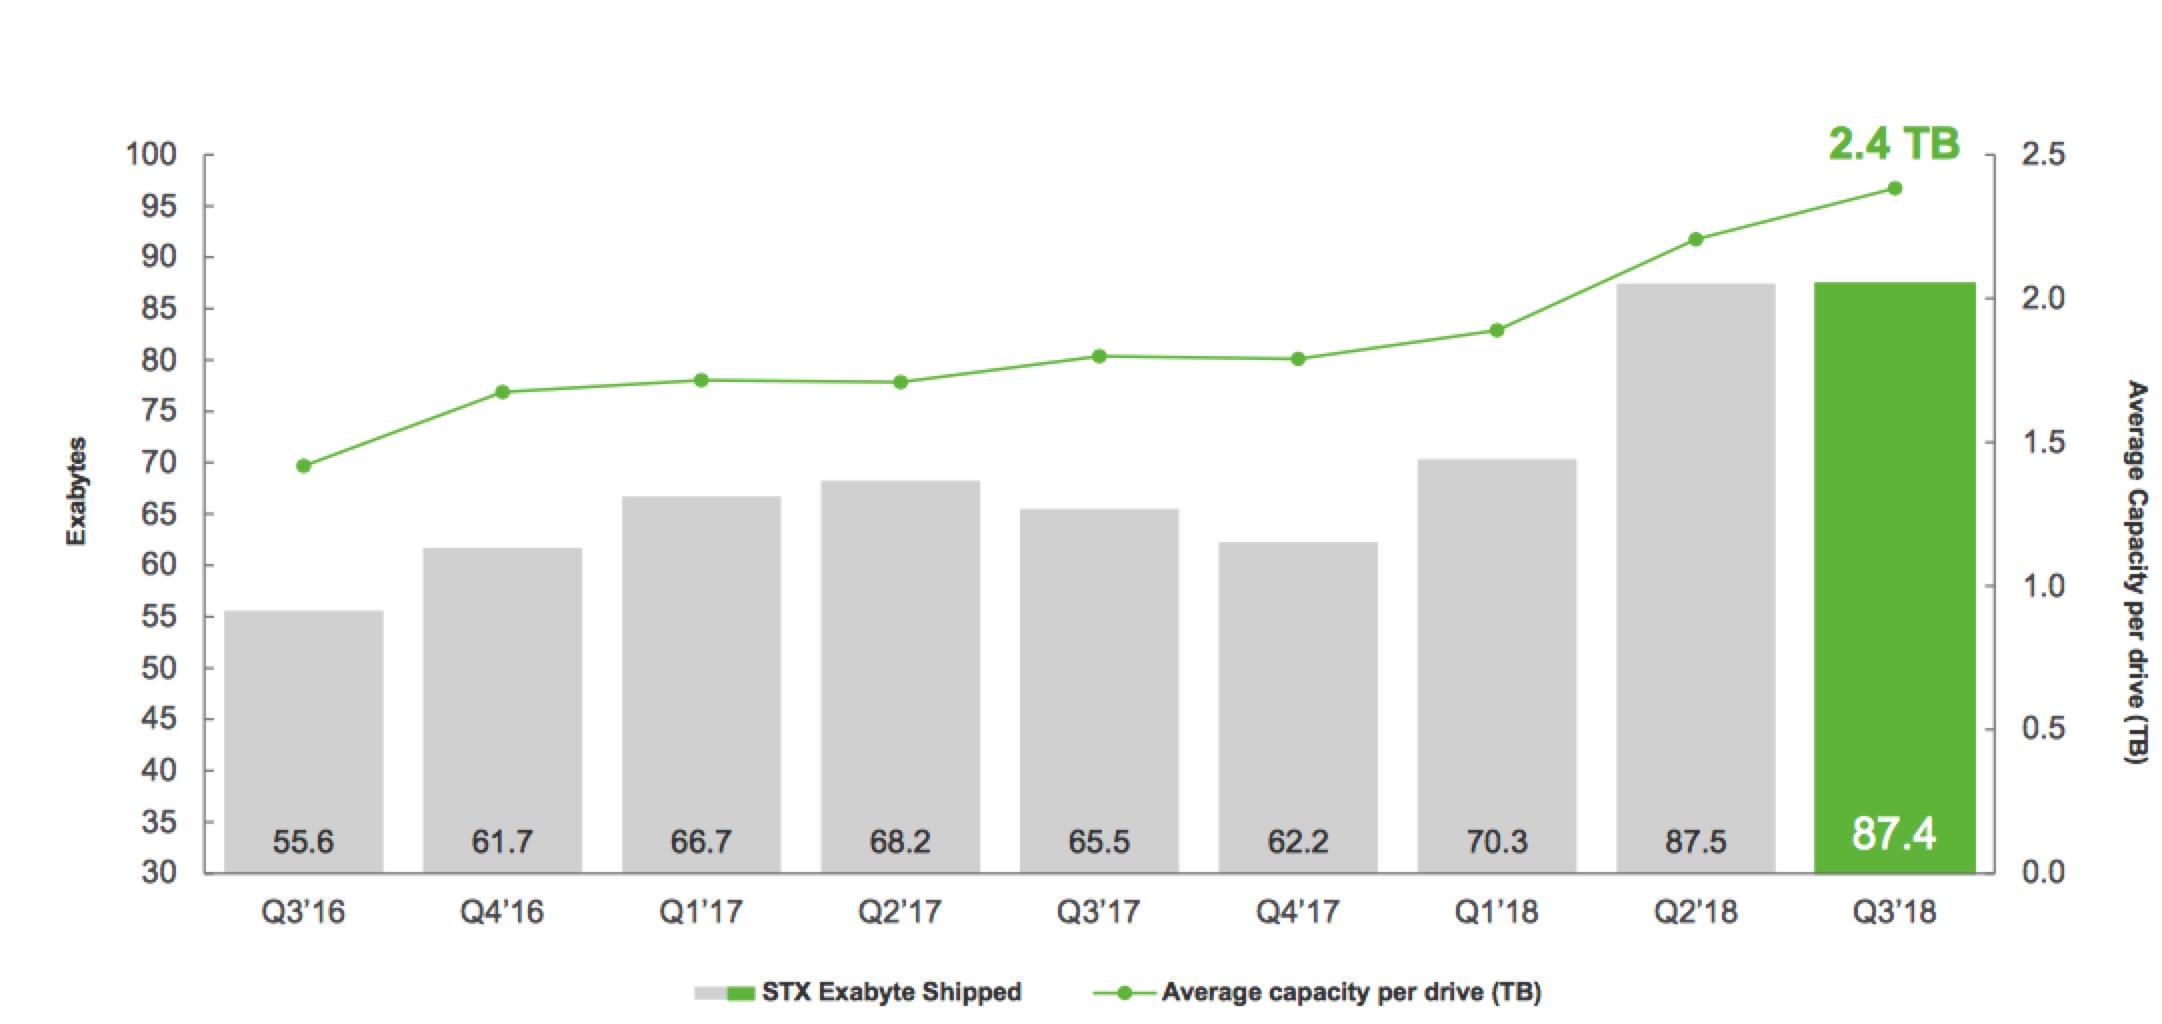
HDD exabyte shipments for this period were 87.4EB, up 34% year over year.
The average capacity per drive across the HDD portfolio was a record 2.4TB, up 32% Y/Y.
The average selling price per unit was $70.50, up yearly 6%.
According to executives' comments on the quarter, the hardware storage company shipped a record 43.8EB in enterprise HDD market, with a record average capacity of 4.8TB per drive; in the nearline market, it shipped 41.3EB, and average capacity per drive reached 6.5TB per unit, up 41% over last year and up 64% from the March quarter two years ago; 10TB nearline product was the leading enterprise revenue SKU in the March quarter. In addition, it achieved significant sequential volume and revenue growth in its 12TB nearline product as its ramps for material revenue contribution.
Seagate continues to be poor outside HDDs. Revenue from the Cloud Systems and Silicon Group, were $217 million, up 2% sequentially and down 13% Y/Y, representing only 8% of global sales, primarily due to the planned end of life of some legacy OEM cloud systems products and the divestiture of high-performance computing assets (HPC ClusterStor arrays sold to Cray.
The company continues minimizing sub-1TB client consumer and mission-critical 15,000rpm markets, as it believes these application workloads will move over time to either silicon-based memory or cloud storage. In the March quarter, these products represented less than 8% of consolidated revenue.
The firm is progressing towards the introduction of HAMR technology. This next-generation recording platform will push capacity points up 24TB per drive and beyond. It anticipates launching HAMR portfolio in volume in 2019.
Seagate expects total revenues to be flat sequentially reflecting quarterly year-over-year revenue growth of around 17% with continued strong enterprise demand and tight supply for its highest capacity solutions, and total revenue growth of approximately 4% for FY18.
HDD exabyte shipped and average capacity per drive
Click to enlarge
HDD mix trends
| 2Q18 | 3Q18 | |
| EB enterprise mission critical | 2.4 | 2.5 |
| EB enterprise nearline | 35.1 | 41.3 |
| EB client non-compute consumer electronics | 17.1 | 14.6 |
| EB client non-compute consumer | 13.8 | 11.6 |
| EB client compute, desktop+notebook | 19.2 | 17.5 |
| Enterprise as % of total revenue | 40% | 44% |
| Client non-compute as % of total revenue | 30% | 26% |
| Client compute as % of total revenue | 26% | 23% |
Revenue by products in $ million
| 3FQ17 | 3FQ18 | Growth | % of total revenue in 3FQ18 |
|
| HDDs | 2,424 | 2,586 | 7% | 92% |
| Enterprise systems, flash and others |
250 | 217 | -13% | 8% |
Seagate's HDDs from 2FQ15 to 3FQ18
| Fiscal period |
HDD ASP |
Exabytes | Average |
| shipped | GB/drive | ||
| 2Q15 | $61 | 61.3 | 1,077 |
| 3Q15 | $62 | 55.2 | 1,102 |
| 4Q15 | $60 | 52.0 | 1,148 |
| 1Q16 | $58 | 55.6 | 1,176 |
| 2Q16 | $59 | 60.6 | 1,320 |
| 3Q16 | $60 | 55.6 | 1,417 |
| 4Q16 | $67 | 61.7 | 1,674 |
| 1Q17 | $67 | 66.7 | 1,716 |
| 2Q17 | $66 | 68.2 | 1,709 |
| 3Q17 | $67 | 65.5 | 1,800 |
| 4Q17 | $64 | 62.2 | 1,800 |
| 1Q18 | $64 | 70.3 | 1,900 |
| 2Q18 | $68 | 87.5 | 2,200 |
| 3Q18 | $70.5 | 87.4 | 2,400 |
Seagate vs. WD for 3FQ18
(revenue and net income in $ million, units in million)
| Seagate | WD | % in favor of WD |
|
| Revenue | 2,803 | 5,013 | 79% |
| Net income | 381 | 137 | NA |
| HDD shipped | 36.0-37.0 | 36.4 | -0% |
| Average GB/drive | 2,400 | 2,755 | 15% |
| Exabytes shipped | 87.4 | 100.3 | 15% |
| HDD ASP | $70.5 | $72 | 2% |
To read the earnings call transcript


 Subscribe to our free daily newsletter

