


Carbonite: Fiscal 4Q17 Financial Results
Revenue stable Q/Q and up 16% Y/Y
This is a Press Release edited by StorageNewsletter.com on February 14, 2018 at 2:36 pm| (in $ million) | 4Q16 | 4Q17 | FY16 | FY17 |
| Revenue | 53.4 | 61.7 | 207.0 | 239.5 |
| Growth | 15% | 16% | ||
| Net income (loss) | (0.7) | (1.6) | (4.1) | (4.0) |
Carbonite, Inc. announced financial results for the quarter and full year ended December 31, 2017.
Full Year 2017 Highlights:
• Revenue of $239.5 million increased 16% year-over-year.
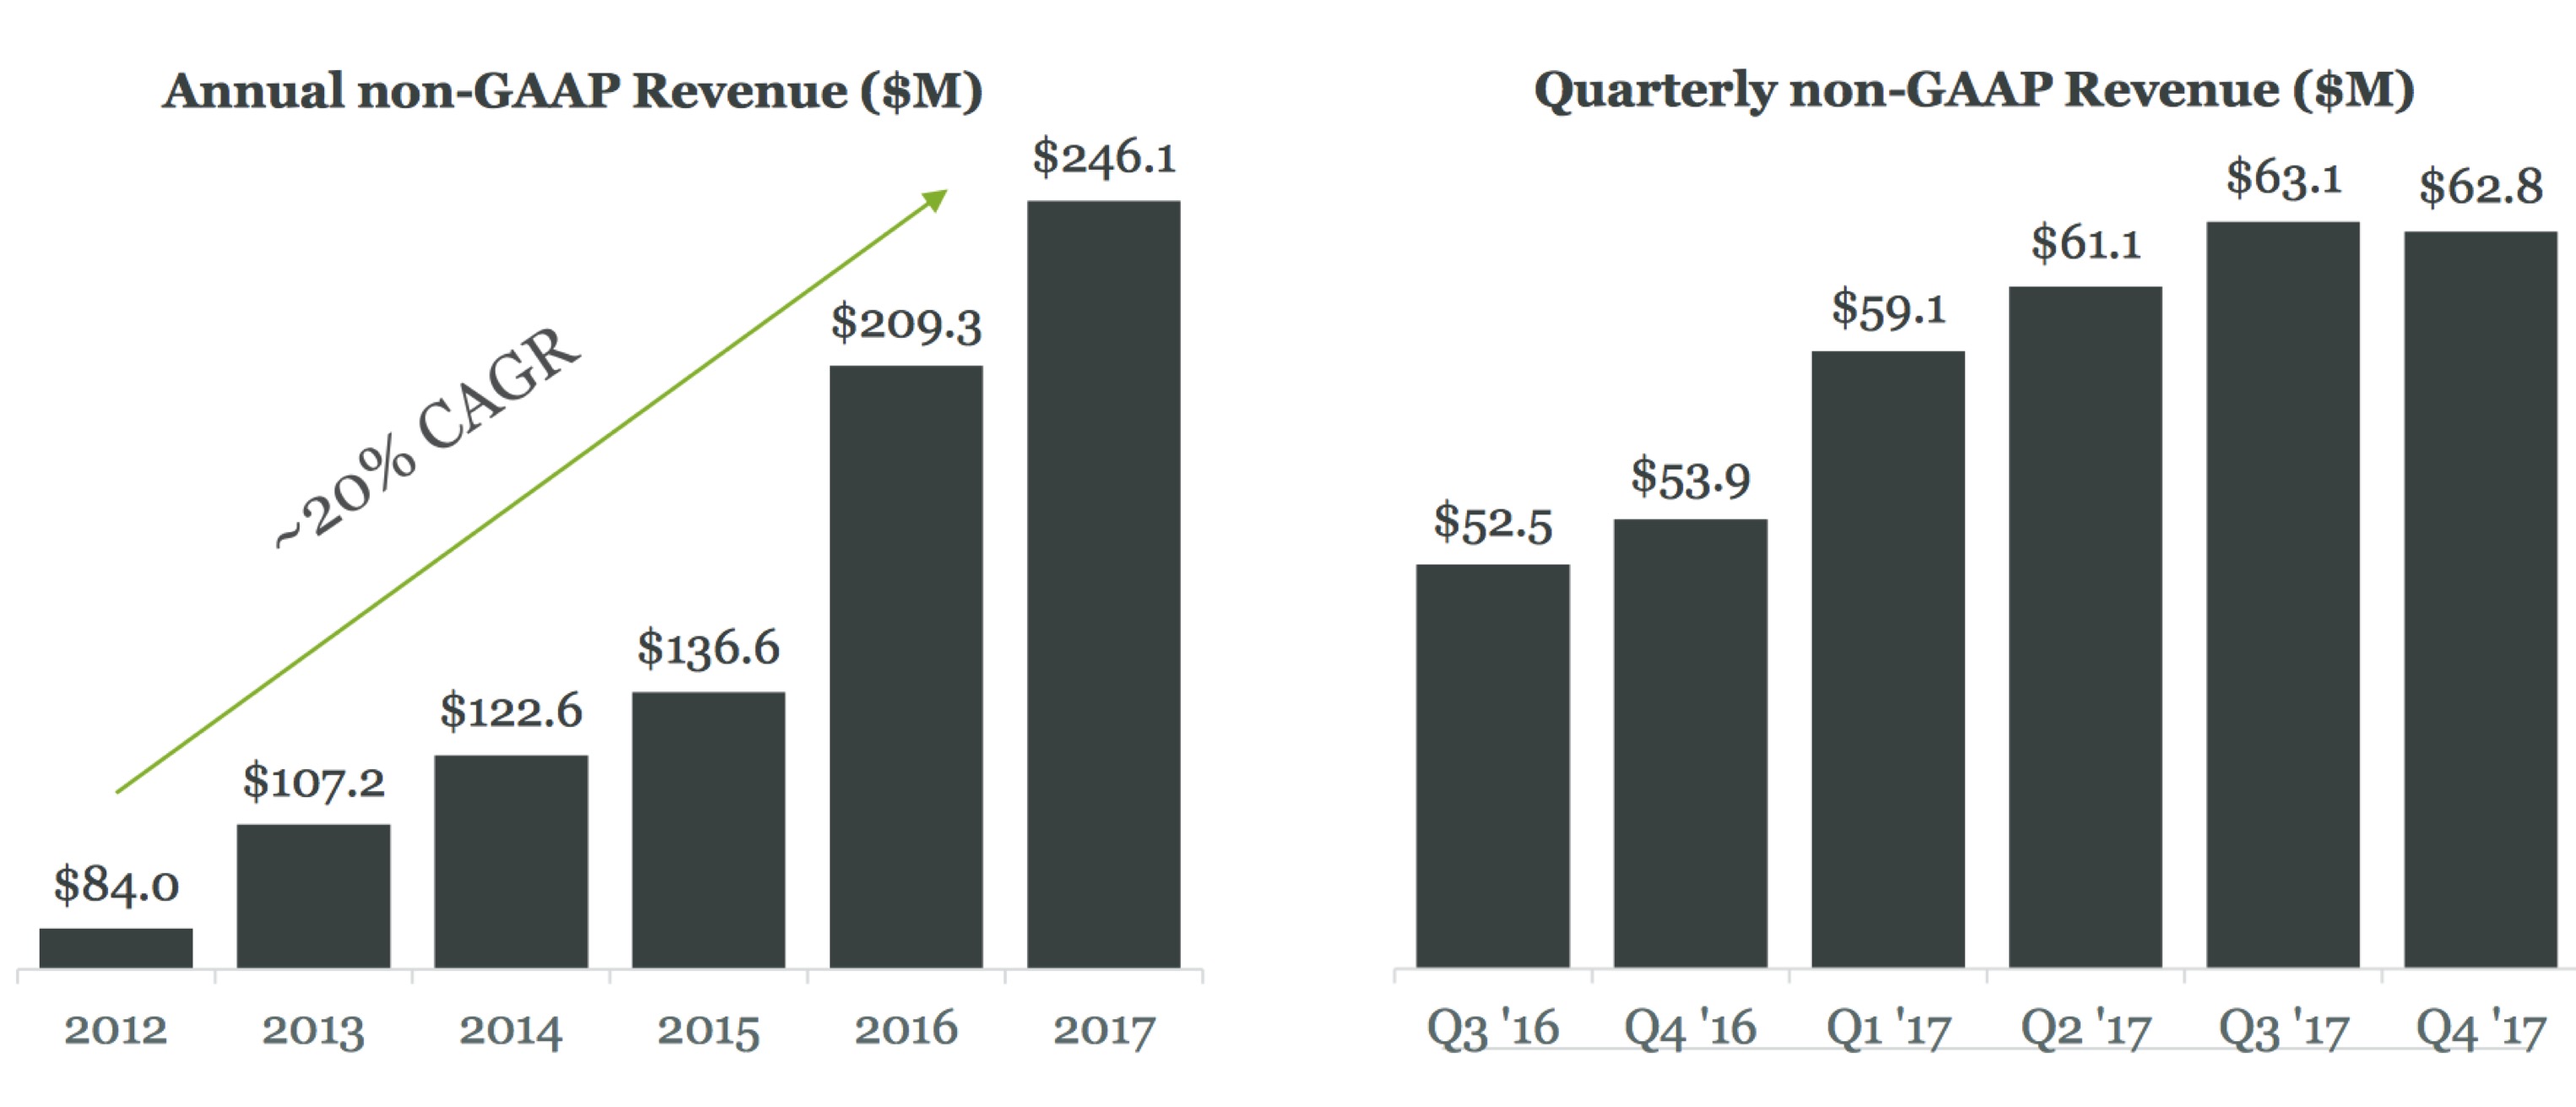
• Non-GAAP revenue of $246.1 million increased 18% year-over-year.
• Bookings of $245.9 million increased 17% year-over-year.
• Net loss per share was ($0.14), as compared to ($0.15) in 2016 (basic and diluted).
• Non-GAAP net income per share was $0.82 (basic) and $0.79 (diluted), as compared to $0.61 (basic) and $0.60 (diluted) in 2016.4
“2017 was another successful year for Carbonite. We built and integrated the major elements of our leading data protection platform for businesses. We launched new programs and tools to better enable our partners, and again we were recognized for excellence in customer support. I am confident in our path forward and our ability to continue to execute the long-term strategic transformation we started just a few years ago,” said Mohamad Ali, president and CEO.
“We delivered solid bookings and revenue growth for the year and a meaningful increase in profitability. We remain focused on operational excellence, continuing to streamline the business and efficiently drive results. Our guidance for 2018 calls for balanced organic and inorganic growth with another significant increase in non-GAAP net income per share,” said Anthony Folger, CFO.
Fourth Quarter 2017 Results:
• Revenue for the fourth quarter was $61.7 million, an increase of 15% from $53.5 million in the fourth quarter of 2016. Non-GAAP revenue for the fourth quarter was $62.8 million, an increase of 17% from $53.9 million in the fourth quarter of 2016.
• Bookings for the fourth quarter were $60.2 million, an increase of 11% from $54.0 million in the fourth quarter of 2016.
• Gross margin for the fourth quarter was 72.8%, compared to 72.2% in the fourth quarter of 2016. Non-GAAP gross margin was 77.6% in the fourth quarter, compared to 74.0% in the fourth quarter of 2016.
• Net loss for the fourth quarter was ($1.6) million, compared to net loss of ($0.7) million in the fourth quarter of 2016. Non-GAAP net income for the fourth quarter was $8.8 million, compared to non-GAAP net income of $3.3 million in the fourth quarter of 2016.4
• Net loss per share for the fourth quarter was ($0.06) (basic and diluted), compared to net loss per share of ($0.02) (basic and diluted) in the fourth quarter of 2016. Non-GAAP net income per share was $0.31 (basic) and $0.30
(diluted) for the fourth quarter, compared to non-GAAP net income per share of $0.12 (basic and diluted) in the fourth quarter of 2016.
• Cash flow from operations for the fourth quarter was $13.9 million, compared to $9.8 million in the fourth quarter of 2016. Adjusted free cash flow for the fourth quarter was $9.7 million, compared to $6.9 million in the fourth quarter of 2016.
Full Year 2017 Results:
• Revenue for the full year was $239.5 million, an increase of 16% from $207.0 million in 2016. Non-GAAP revenue for the full year was $246.1 million, an increase of 18% from $209.3 million in 2016.
• Bookings for the full year were $245.9 million, an increase of 17% from $209.3 million in 2016.
• Gross margin for the full year was 70.7%, compared to 70.6% in 2016. Non-GAAP gross margin was 75.5% in the full year, compared to 72.6% in 2016.
• Net loss for the full year was ($4.0 million), compared to a net loss of ($4.1 million) in 2016. Non-GAAP net income for the full year was $22.8 million, compared to non-GAAP net income of $16.4 million in 2016.
• Net loss per share for the full year was ($0.14) (basic and diluted), compared to a net loss per share of ($0.15) (basic and diluted) in 2016. Non-GAAP net income per share was $0.82 (basic) and $0.79 (diluted) for the full year, compared to non-GAAP net income per share of $0.61 (basic) and $0.60 (diluted) in 2016.
• Total cash and cash equivalents were $128.2 million as of December 31, 2017, compared to $59.2 million as of December 31, 2016.
• Cash flow from operations for the full year was $31.3 million, compared to $13.2 million in 2016. Adjusted free cash flow for the full year was $20.2 million, compared to $18.2 million in 2016.
Comments
For the quarter, revenue increased 15% Y/Y at $61.7 million to be compared to $61.6 million for the former three-month period also recording net losses.
For next quarter the company expects GAAP revenue from $61.7 million to $63.7 million, up 3%.
For full year 2018, consumer bookings is supposed to grow 15% from $223.8 million to $234.8 (+5%) and GAAP revenue from $294.0 to $304.0 million (+3%).
Revenue growth
Abstracts of the earnings call transcript:
Mohamad Ali, CEO and president:
"We remain on track to launch Carbonite Recover in the first half of 2018."
Anthony Folger, CFO:
"For the full year 2017, our total business bookings were $164.1 million as compared to our full year guidance of $163.8 million to $168.8 million. And our business subscription bookings were up 16% for the full year 2017."


 Subscribe to our free daily newsletter

