


2017 Cost of Data Breach Study in USA – Ponemon and IBM
Increased from $7.01 million to $7.35 million from 2016 to 2017, $225 per lost or stolen record
This is a Press Release edited by StorageNewsletter.com on January 11, 2018 at 2:27 pmThis benchmark research was sponsored by IBM Security Independently and conducted by Ponemon Institute LLC on June 2017.
2017 Cost of Data Breach Study: United States
Part 1. Introduction
IBM Security and Ponemon Institute presents the 2017 Cost of Data Breach Study: United States (This report is dated in the year of publication rather than the fieldwork completion date. Please note that the majority of data breach incidents studied in the current report happened in the 2015 calendar year.), the 12th annual benchmark study on the cost of data breach incidents for companies located in the United States.
The average cost for each lost or stolen record containing sensitive and confidential information increased from $221 to $225. The average total cost experienced by organizations over the past year increased from $7.01 million to $7.35 million. To date, 572 U.S. organizations have participated in the benchmarking process since the inception of this research.
United States study at a glance:
. 63 companies participated
. $7.35 million is the average total cost of data breach
. 5% increase in the total cost of data breach
. $225 is the average cost per lost or stolen record
. 2% increase in cost per lost or stolen record
Ponemon conducted its first Cost of Data Breach Study in the United States 12 years ago.
Since then, we have expanded the study to include the following countries and regions:
. UK
. Germany
. Australia
. France
. Brazil
. Japan
. Italy
. India
. Canada
. South Africa
. The Middle East (including the United Arab Emirates and Saudi Arabia)
. ASEAN region (including Singapore, Indonesia, the Philippines and Malaysia
The 2017 study examines the costs incurred by 63 U.S. companies in 16 industry sectors after those companies experienced the loss or theft of protected personal data and the notification of breach victims as required by various laws. It is important to note that costs presented in this research are not hypothetical but are from actual data loss incidents. They are based upon cost estimates provided by individuals we interviewed over a 10-month period in the companies that are represented in this research.
The number of breached records per incident this year ranged from 5,563 to 99,500 records. The average number of breached records was 28,512. We did not recruit organizations that have data breaches involving more than 100,000 compromised records. These incidents are not indicative of data breaches most organizations incur. Thus, including them in the study would have artificially skewed the results.
Why the cost of data breach fluctuates across countries?
What explains the significant increases in the cost of data breach this year for organizations in the Middle East, the United States and Japan? In contrast, how did organizations in Germany, France, Australia, and the UK succeed in reducing the costs to respond to and remediate the data breach? Understanding how the cost of data breach is calculated will explain the differences among the countries in this research.
For the 2017 Cost of Data Breach Study: Global Overview, we recruited 419 organizations in 11 countries and two regions to participate in this year’s study. More than 1,900 individuals who are knowledgeable about the data breach incident in these 419 organizations were interviewed. The first data points we collected from these organizations were: (1) how many customer records were lost in the breach (i.e. the size of the breach) and (2) what percentage of their customer base did they lose following the data breach (i.e. customer churn). This information explains why the costs increase or decrease from the past year.
In the course of our interviews, we also asked questions to determine what the organization spent on activities for the discovery of and the immediate response to the data breach, such as forensics and investigations, and those conducted in the aftermath of discovery, such as the notification of victims and legal fees. A list of these activities is shown in Part 3 of this report. Other issues covered that may have an influence on the cost are the root causes of the data breach (i.e. malicious or criminal attack, insider negligence or system glitch) and the time to detect and contain the incident.
It is important to note that only events directly relevant to the data breach experience of the 419 organizations represented in this research and discussed above are used to calculate the cost. For example, new regulations, such as the General Data Protection Regulation (GDPR), ransomware and cyber attacks, such as Shamoon, may encourage organizations to increase investments in their governance practices and security-enabling technologies but do not directly affect the cost of a data breach as presented in this research.
The calculation of the components of the cost of data breach that affect the cost
The following information presents the data that is used to calculate the cost and the factors that may increase or decrease these costs. We believe such information will help organizations make better decisions about how to allocate resources to minimize the financial consequences when the inevitable data breach strikes.
- The unexpected and unplanned loss of customers following a data breach (churn rate): Programs that preserve customer trust and loyalty in advance of the breach will help reduce the number of lost business/customers. In this year’s research, more organizations worldwide lost customers as a result of their data breaches. However, as shown, having a senior-level leader such as a chief privacy officer or chief information security officer who will be able to direct initiatives that improve customers’ trust in how the organization safeguards their personal information will reduce churn and the cost of the breach. Organizations that offer data breach victims breach identity protection in the aftermath of the breach are also more successful in reducing churn.
- The size of the breach or the number of records lost or stolen: It makes sense that the more records lost, the higher the cost of data breach. Therefore, data classification schema and retention programs are critical to having visibility into the sensitive and confidential information that is vulnerable to a breach and reducing the volume of such information.
- The time it takes identify and contain a data breach:
The faster the data breach can be identified and contained, the lower the costs. In this year’s study, organizations were able to reduce the days to identify the data breach from an average of approximately 201 in 2016 to 191 days and the average days to contain the data breach from 70 to 66 days. We attribute these improvements to investments in such enabling security technologies as security analytics, SIEM, enterprise wide encryption and threat intelligence sharing platforms. In contrast, security complexity and the deployment of disruptive technologies can affect the time to detect and contain a data breach. Although some complexity in an IT security architecture is expected to deal with the many threats facing organizations, too much complexity can impact the ability to respond to data breaches. Disruptive technologies, access to cloud-based applications and data as well as the use of mobile devices (including BYOD and mobile apps) increase the complexity of dealing with IT security risks and data breaches. As shown in the research, cloud migration at the time of the data breach and mobile platforms were shown to increase the cost. - The detection and escalation of the data breach incident: Detection and escalation costs include forensic and investigative activities, assessment and audit services, crisis team management and communications to executive management and board of directors. Investments in governance, risk management and compliance (GRC) programs that establish an internal framework for satisfying governance requirements, evaluating risk across the enterprise and tracking compliance with governance requirements can improve an organization’s ability to detect and escalate a data breach.
- Post data breach costs, including the cost to notify victims:
These costs include help desk activities, inbound communications, special investigative activities, remediation, legal expenditures, product discounts, identity protection services and regulatory interventions. The United States had the highest notification costs. The purchase of cyber and data breach insurance can help manage the financial consequences of the incident. As shown in this year’s study, insurance protection and BC management reduced the cost of data breach following the discovery of the incident. In contrast, the rush to notify victims without understanding the scope of the breach, compliance failures and the engagement of consultants all increase post data breach costs. Expenditures to resolve lawsuits also increase post data breach costs. - An attack by a malicious insider or criminal is costlier than system glitches and negligence (human factor):
Almost half of organizations represented in this research (47%) identified the root cause of the data breach as a malicious or criminal attack and the average cost was approximately $156. In contrast system glitches and human error or negligence averaged approximately $128 and $126, respectively. Factors that may decrease the cost are participation in threat sharing, use of security analytics and the recruitment and retention of knowledgeable personnel.
In conclusion, organizations in Australia, Germany, France and the UK were able to improve their ability to keep customers and, as a result, reduced the cost of data breach.
Organizations in Australia, the UK and Germany also were able to limit the number of customer records lost or stolen and, as a result, had lower costs. Whereas, countries in the Middle East and the United States experienced a higher%age of churn and had higher costs. Organizations in Brazil, India, the Middle East and South Africa had data breaches involving more lost or stolen records, which increased their costs. The individual country reports present in greater detail the cost components and factors that affected the cost.
The following are the most salient findings and implications for organizations:
- The cost of data breach sets a record high. According to this year’s benchmark findings, data breaches cost companies an average of $225 per compromised record – of which $146 pertains to indirect costs, including abnormal turnover or churn of customers and $79 represents the direct costs incurred to resolve the data breach, such as investments in technologies or legal fees.
- The total average organizational cost of data breach reaches a new high. This year, we record the highest average total cost of data breach at $7.35 million. Prior to this year’s research, the most costly breach occurred in 2011 when companies spent an average of $7.24 million. In 2013, companies experienced the lowest total data breach cost at $5.40 million.
- Measures reveal why the cost of data breach increases. The average total cost of data breach increased 4.7%, the average per capita cost increased by 1.8% and abnormal churn of existing customers increased 5%. In the context of this paper, abnormal churn is defined as a greater-than-expected loss of customers in the normal course of business. In contrast, the average size of a data breach (number of records lost or stolen) decreased 1.9%.
- Certain industries have higher data breach costs. Heavily regulated industries such as health care ($380 per capita) and financial services ($336 per capita), had per capita data breach costs well above the overall mean of $225. In contrast, public sector organizations ($110 per capita) had a per capita cost of data breach below the overall mean.
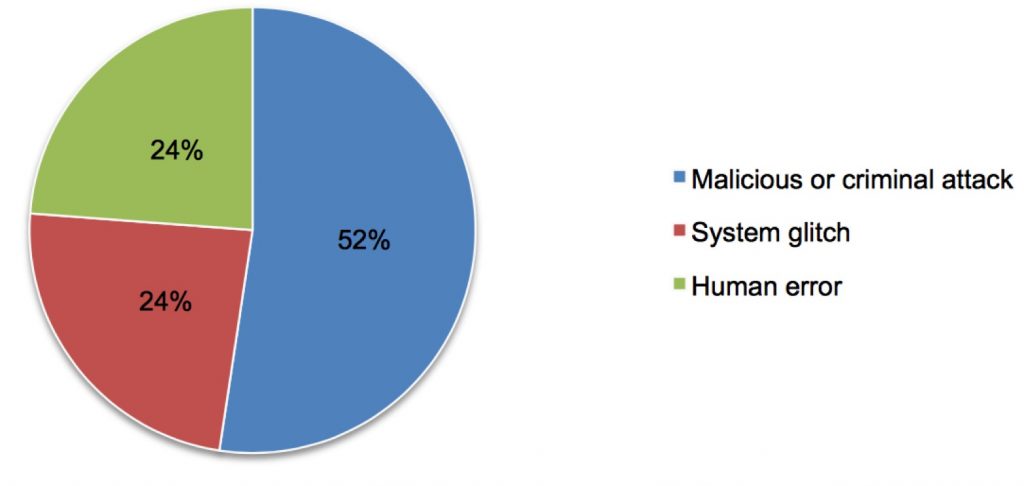
- Malicious or criminal attacks continue to be the primary cause of data breach. 52% of incidents involved a malicious or criminal attack, 24% of incidents were caused by negligent employees, and another 24% were caused by system glitches, including both IT and business process failures.
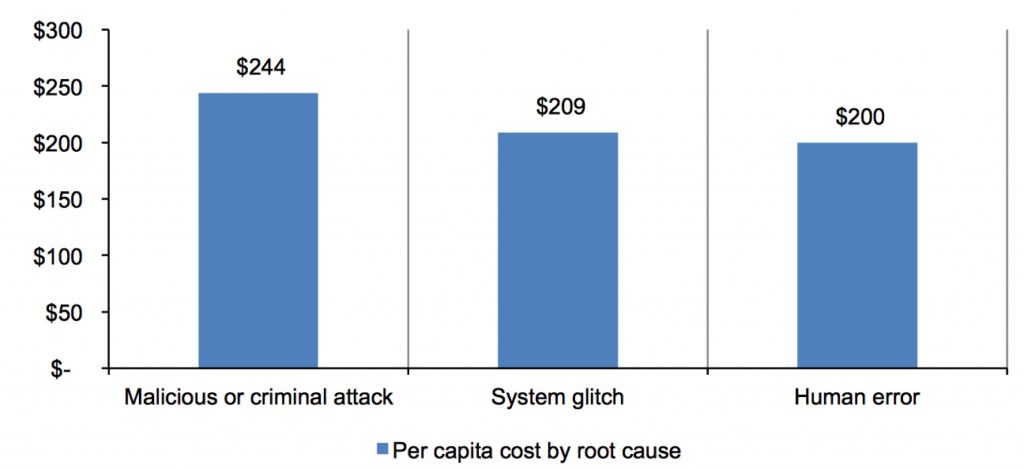
- Malicious attacks are the costliest. Organizations that had a data breach due to malicious or criminal attacks had a per capita data breach cost of $244, which is above the mean. In contrast, system glitches or human error as the root cause had per capita costs below the mean ($209 and $200 per capita, respectively).
- Four new factors are in this year’s cost analysis. The following factors that influence data breach costs have been added to this year’s study. They are as follows: (1) compliance failures, (2) the extensive use of mobile platforms, (3) CPO appointment and (4) the use of security analytics. The use of security analytics reduced the per capita cost of data breach by $7.7 and the appointment of a CPO reduced the cost by $4.3. However, extensive use of mobile platforms at the time of the breach increased the cost by $6.5 and compliance failures increased the per capita cost by $19.3.
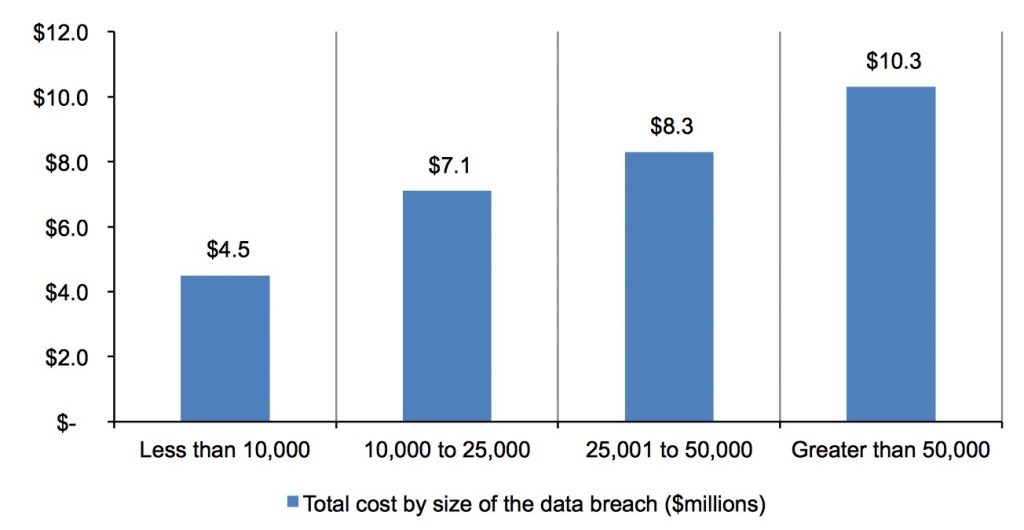
- The more records lost, the higher the cost of data breach. This year, for companies with data breaches involving less than 10,000 records, the average total cost of data breach was $4.5 million and companies with the loss or theft of more than 50,000 records had a cost of data breach of $10.3 million.
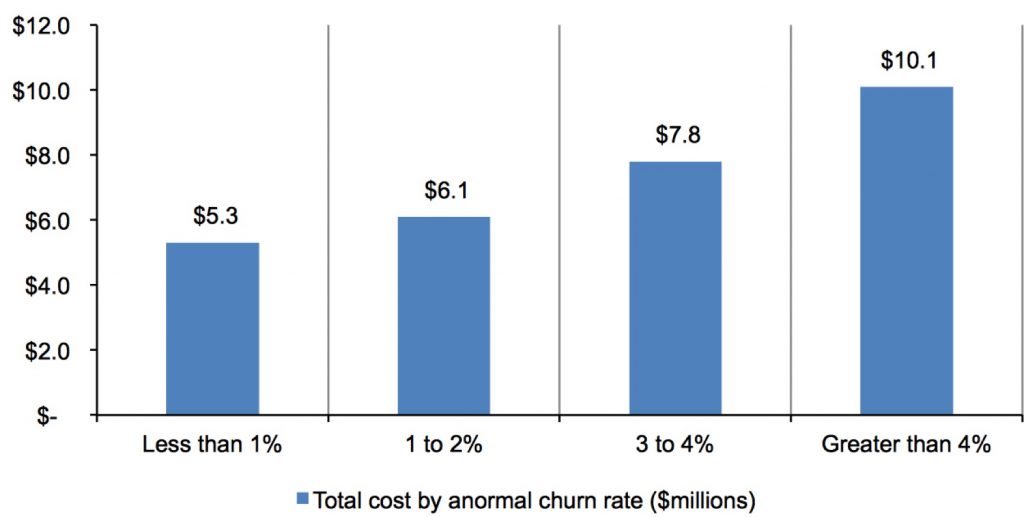
- The more churn, the higher the cost of data breach. Companies that experienced less than 1% churn or the loss of existing customers, had an average total cost of data breach of $5.3 million and those that experienced churn greater than 4% had an average total cost of data breach of $10.1 million.
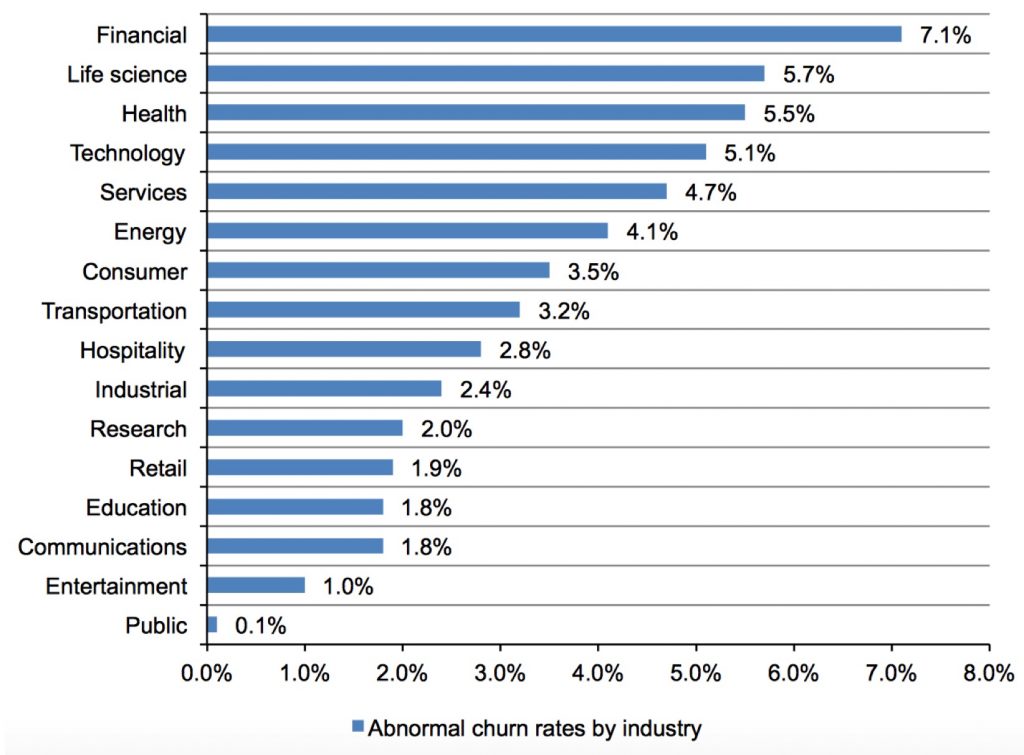
- Certain industries are more vulnerable to churn. Financial, life science, health, technology and service organizations experience a relatively high abnormal churn rate and public sector and entertainment organizations experienced a relatively low abnormal churn rate.
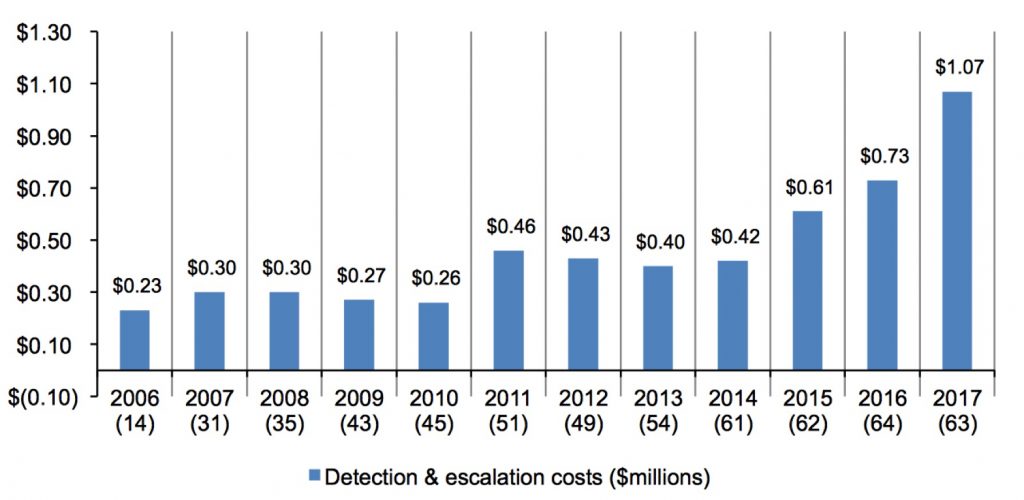
- Detection and escalation costs are at a record high. These costs include forensic and investigative activities, assessment and audit services, crisis team management, and communications to executive management and board of directors. Average detection and escalation costs increased dramatically from $0.73 million to $1.07 million, suggesting that companies are investing more heavily in these activities.
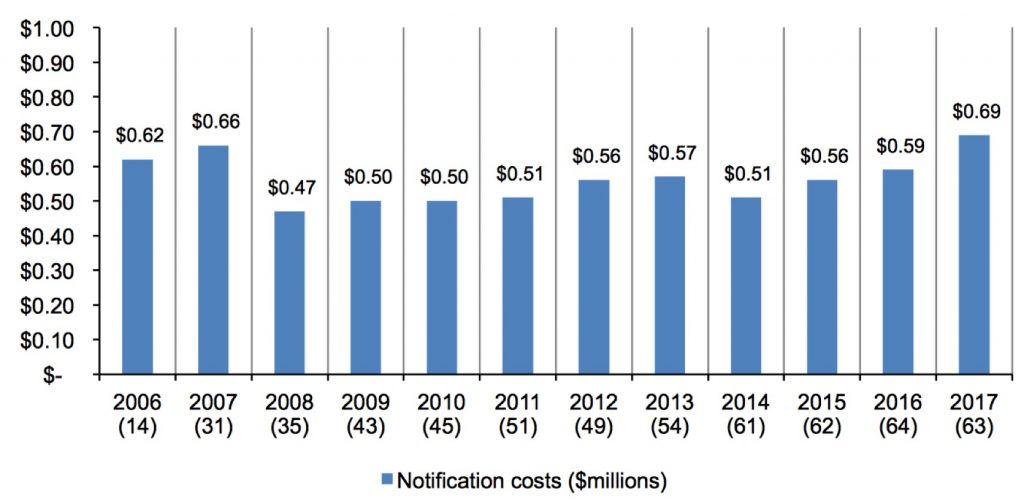
- Notification costs increase slightly. Such costs typically include IT activities associated with the creation of contact databases, determination of all regulatory requirements, engagement of outside experts, postal expenditures, secondary mail contacts or email bounce-backs and inbound communication set-up. This year’s average notification costs increased slightly from $0.59 million in 2016 to $0.69 million in this year’s study.
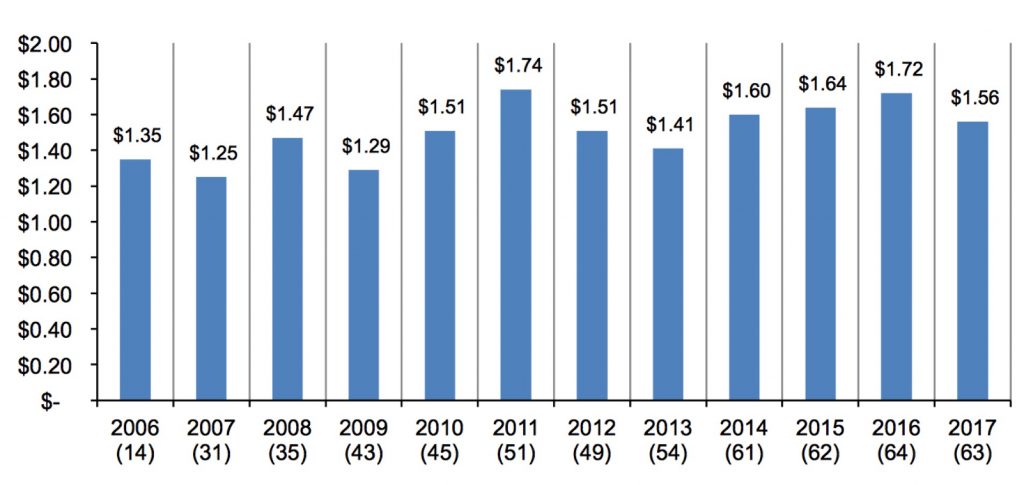
- Post data breach costs decrease. Such costs typically include help desk activities, inbound communications, special investigative activities, remediation activities, legal expenditures, product discounts, identity protection services and regulatory interventions. These costs decreased from $1.72 million in 2016 to $1.56 million in this year’s study.
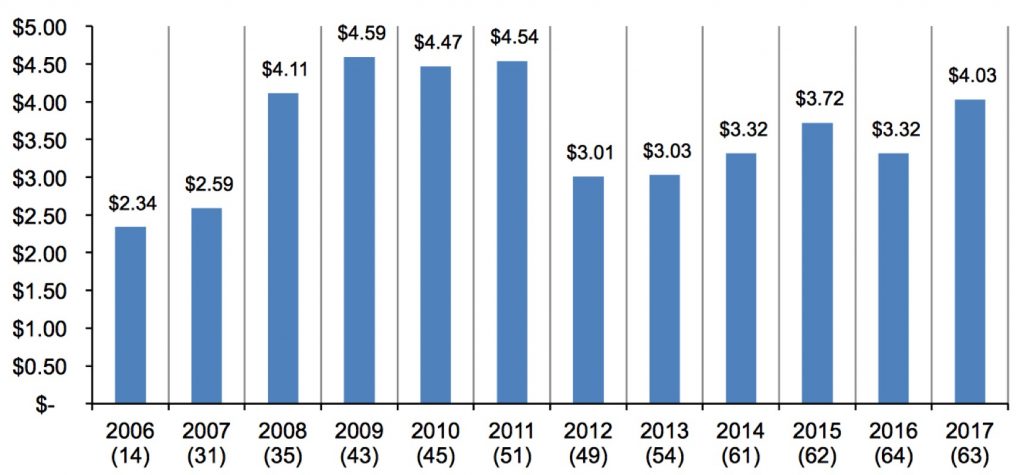
- Lost business costs increase. Such costs include the abnormal turnover of customers, customer acquisition activities, reputation losses and diminished goodwill. The current year’s cost increased from $3.32 million in 2016 to $4.03 million. The highest lost business cost over the past 12 years was $4.59 million in 2009.
- Companies continue to spend more on indirect per capita costs than direct per capita costs. Indirect costs include the time employees spend on data breach notification efforts or investigations of the incident. Direct costs refer to what companies spend to minimize the consequences of a data breach and assist victims. These costs include engaging forensic experts to help investigate the data breach, hiring a law firm and offering victims identity protection services. This year, the indirect costs were $146 and direct costs were $79.
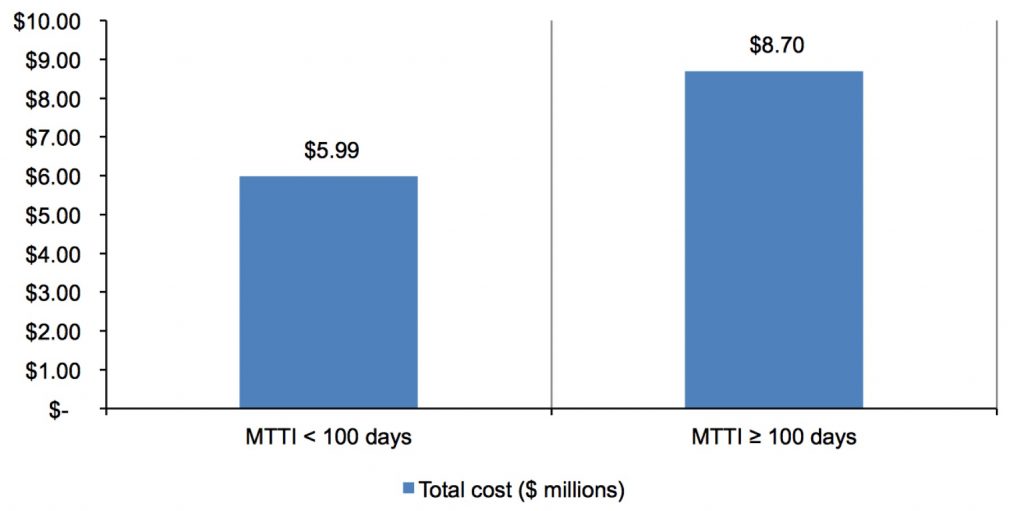
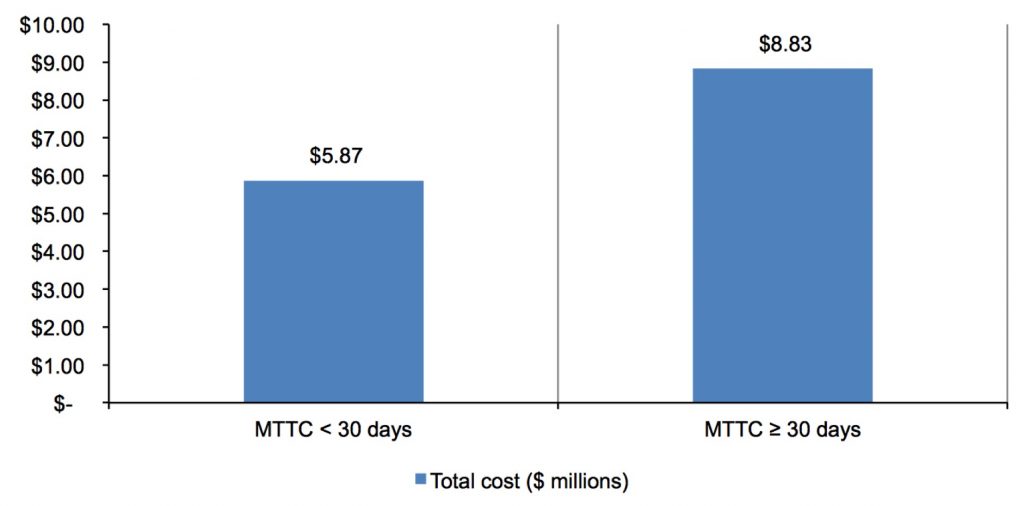
- The time to identify and contain data breaches impact costs. In this year’s study, it took companies an average of 206 days to detect that an incident occurred and an average of 55 days to contain the incident. If the mean time to identify (MTTI) was less than 100 days, the average cost to identify was $5.99 million. However, if the mean time to identify was greater than 100 days the cost rose to $8.70 million. If the mean time to contain (MTTC) the breach was less than 30 days, the average cost to contain was $5.87 million. If it took 30 days or longer, the cost rose to $8.83 million.
Cost of Data Breach FAQs
What is a data breach?
A breach is defined as an event in which an individual’s name plus Social Security number, medical record and/or a financial record or debit card is potentially put at risk-either in electronic or paper format. In our study, we have identified three main causes of a data breach. These are a malicious or criminal attack, system glitch or human error. The costs of a data breach may vary according to the cause and safeguards in place at the time of the data breach.
What is a compromised record?
We define a record as information that identifies the natural person (individual) whose information has been lost or stolen in a data breach. Examples include a retail company’s database with an individual’s name associated with credit card information and other personally identifiable information or a health insurer’s record of the policyholder with physician and payment information. In this year’s study, each lost or stolen record cost the organization an average of $225.
How do you collect the data?
Ponemon Institute researchers collected in-depth qualitative data through interviews conducted over a 10-month period. Recruiting organizations for the 2017 study began in February 2016 and interviews were completed in March 2017. In each of the 63 participating organizations, we spoke with IT, compliance and information security practitioners who are knowledgeable about their organization’s data breach and the costs associated with resolving the breach. For privacy purposes, we did not collect any organization-specific information.
How do you calculate the cost of data breach?
To calculate the average cost of data breach, we collect both the direct and indirect expenses the organization incurs. Direct expenses include engaging forensic experts, outsourcing hotline support and providing free credit monitoring subscriptions and discounts for future products and services. Indirect costs include in-house investigations and communications as well as the extrapolated value of customer loss resulting from turnover or diminished customer acquisition rates.
How does benchmark research differ from survey research?
The unit of analysis in the Cost of Data Breach Study is the organization. In survey research, the unit of analysis is the individual. We recruited 63 organizations to participate in this study. Data breaches range from a low of 5,563 compromised records to slightly less than 100,000 compromised records.
Can the average cost of data breach be used to calculate the financial consequences of a mega breach such as one involving millions of lost or stolen records?
The average cost of a data breach in our research does not apply to catastrophic or mega data breaches because these are not typical of the breaches most organizations experience. To be representative of the population of U.S. organizations and draw conclusions from the research that can be useful in understanding costs when protected information is lost or stolen, we did not include data breaches of more than 100,000 compromised records in our analysis.
Do you track the same organizations each year?
Each annual study involves a different sample of companies. In other words, we do not track the same sample of companies over time. To be consistent, we recruit and match companies with similar characteristics such as the company’s industry, headcount, geographic footprint and size of data breach. Since starting this research more than 12 years ago, we have studied the data breach experiences of 572 U.S. organizations.
Part 2. Key Findings
In this section we provide the detailed findings of this research. Topics are presented in the following order:
. Trends in the cost of data breach
. The root causes of a data breach
. Factors that influence the cost of data breach
. Trends in the cost components of data breach
. The time to identify and contain a data breach affects costs
. Trends in practices to reduce the risk and consequences of a data breach
Trends in the cost of data breach
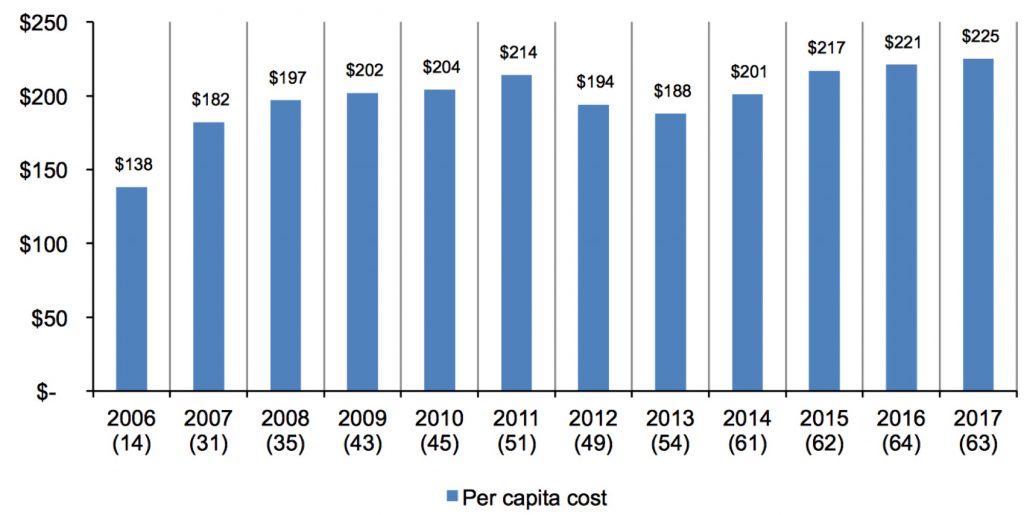
The cost of data breach sets a new record high. Figure 1 reports the average per capita cost of a data breach since the inception of this research series 12 years ago. (Per capita cost is defined as the total cost of data breach divided by the size of the data breach in terms of the number of lost or stolen records.) According to this year’s findings, data breaches cost companies an average of $225 per compromised record, of which $146 pertains to indirect costs, which include abnormal turnover or churn of customers. Direct costs of $79 are the costs incurred to resolve the data breach, such as investments in technologies or legal fees. Last year’s indirect costs were $145 and direct costs were $76.
Figure 1. The average per capita cost of data breach over the past 12 years
Bracketed number defines the benchmark sample size
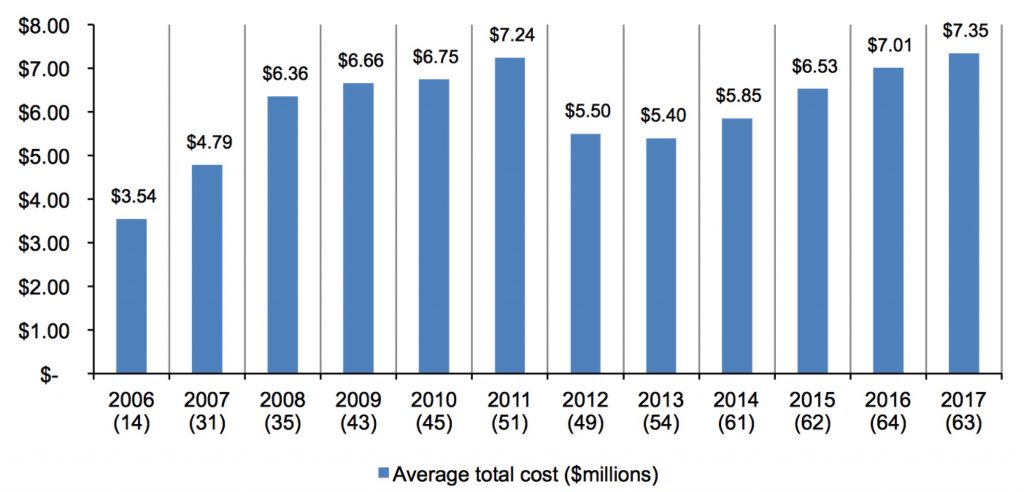
The total average organizational cost of data breach reaches a new high. This year we record the highest average total cost of data breach at $7.35 million. Prior to this year’s research, the most costly breach occurred in 2011, when companies spent an average of $7.24 million. In 2013, companies experienced the lowest total data breach cost at $5.40 million.
Figure 2. The average total organizational cost of data breach over the past 12 years
(in $ million)
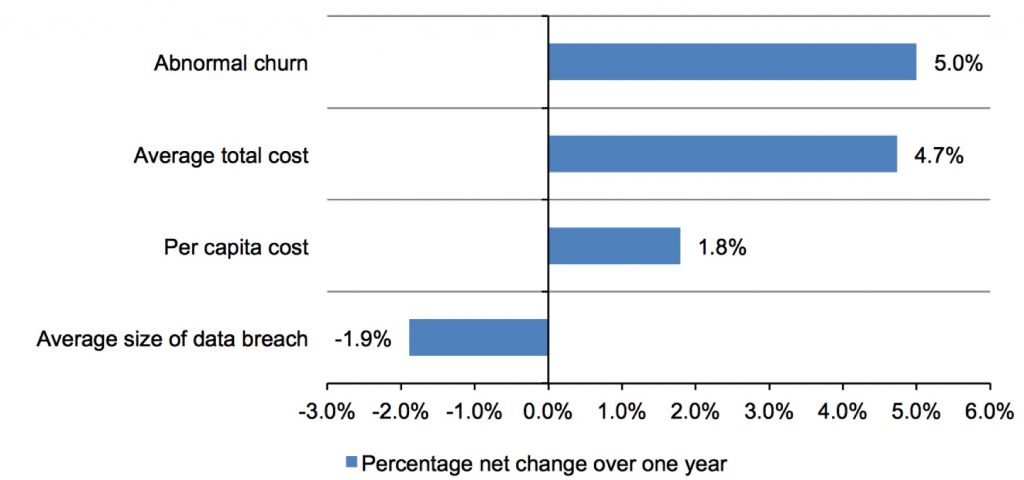
Measures reveal why the cost of data breach increases. Figure 3 reports the four net changes from last year’s report. The average total cost increased 4.7% and the average per capita cost rose 1.8%. Abnormal churn of existing customers increased by 5%. The average size of a data breach (number of records lost or stolen) decreased by 1.9%.
Figure 3. Cost of data breach measures
Net change defined as the difference between the 2017 and 2016 results
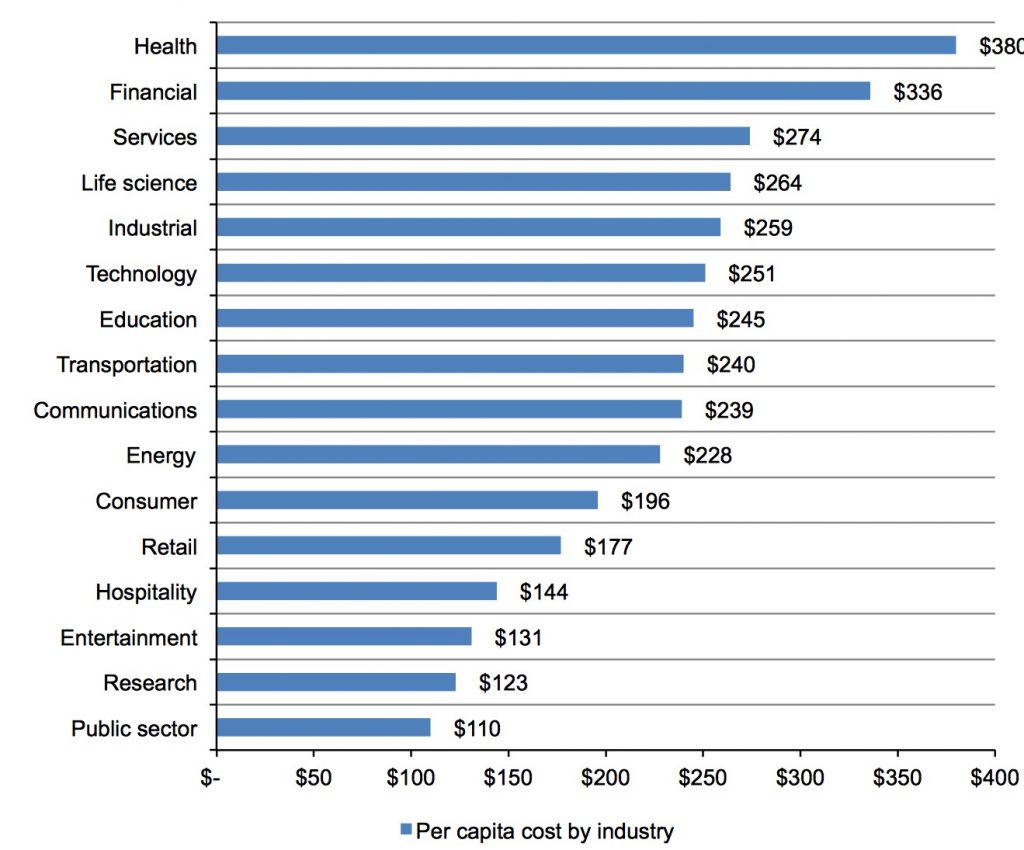
Certain industries have higher data breach costs.
Figure 4 reports the per capita costs for 16 industry sectors. Though a small sample size prevents us from generalizing industry cost differences, the pattern of industry results is consistent with previous research.
Specifically, heavily regulated industries such as health care, life science and financial services had a per capita data breach cost that is substantially above the overall mean of $225. In contrast, public sector (government), research and entertainment companies had a per capita cost well below the overall mean value.
Figure 4. Per capita cost by industry
The root causes of a data breach
Malicious or criminal attacks continue to be the primary cause of data breach. (Negligent insiders are individuals who cause a data breach because of their carelessness, as determined in a post data breach investigation. Hackers or criminal insiders (employees, contractors or other third parties) cause malicious attacks.) Figure 5 summarizes the main root causes of data breach for all 63 organizations. 52% of incidents involved a malicious or criminal attack, 24% were negligent employees and another 24% involved system glitches that includes both IT and business process failures. (The most common types of attacks include malware infections, criminal insiders, phishing/social engineering and SQL injection.)
Figure 5. Distribution of the benchmark sample by root cause of the data breach
Malicious attacks are the costliest.
Figure 6 reports the per capita cost of data breach for the above three root causes. These results are consistent with prior years, wherein the most costly breaches involve malicious acts against the company. Companies with a data breach due to malicious or criminal attacks had an average per capita data breach cost of $244. In contrast, system glitches or human error as the root cause had per capita costs below the mean ($209 and $200, respectively).
Figure 6. Per capita cost for three root causes of the data breach
Factors that influence the cost of data breach
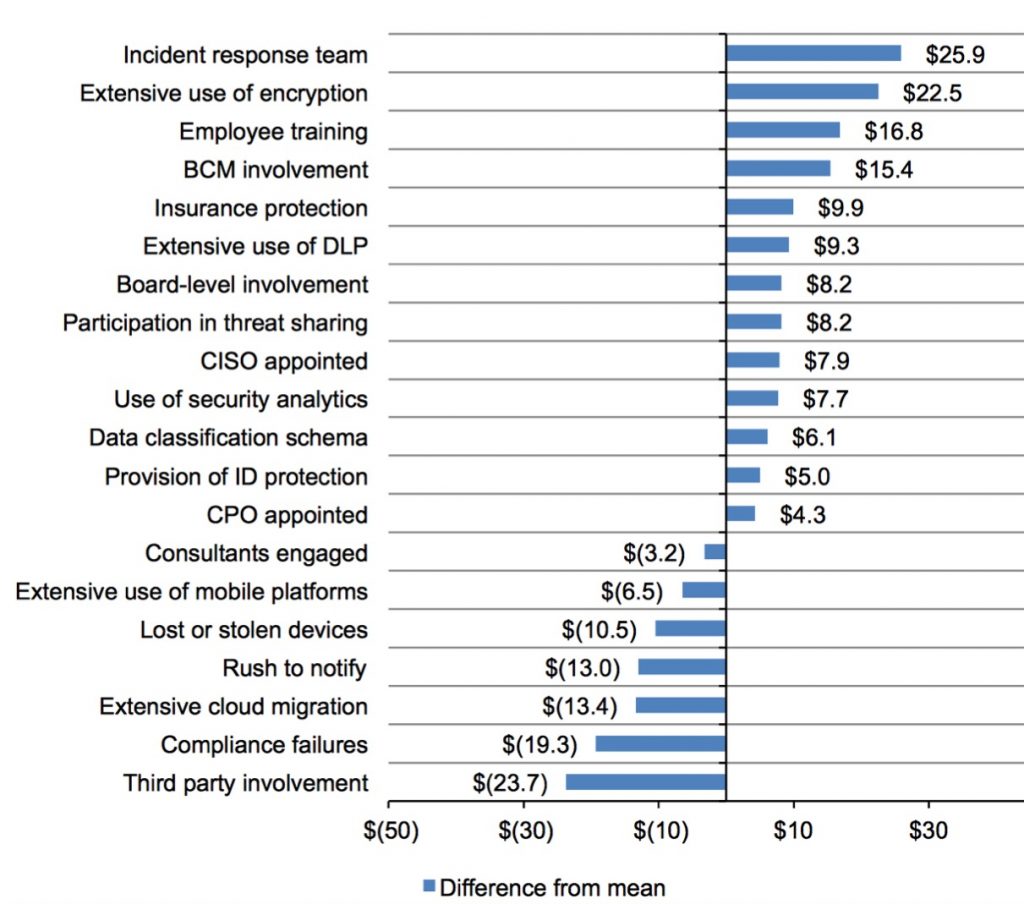
Four new factors are in this year’s cost analysis. As shown in Figure 7, the following factors that influence data breach costs have been added to this year’s study. They are as follows: (1) compliance failures, (2) the extensive use of mobile platforms, (3) CPO appointment and (4) the use of security analytics. The use of security analytics reduced the per capita cost of data breach by $7.7 and the appointment of a CPO reduced the cost by $4.3. However, the extensive use of mobile platforms at the time of the breach increased the cost by $6.5, and compliance failures increased the per capita cost by $19.3.
Having an incident response plan and team in place, extensive use of encryption, employee training, BCM involvement and extensive use of data loss prevention technologies all reduce the cost of data breach by more than $9 per compromised record.
Data breaches due to third party error, compliance failure, extensive migration to the cloud, rush to notify and lost or stolen devices increased data breach costs by more than $10 per compromised record. To illustrate, a fully functional incident response team decreased the per capita cost of data breach from $225 to $199. In contrast, third party involvement in the breach incident increased the per capita cost from $225 to $249.
Figure 7. Impact of 20 factors on the per capita cost of data breach
The more records lost, the higher the cost of data breach. Figure 8 shows the relationship between the total cost of data breach and the size of the incident for 63 U.S. companies in ascending order by the size of the breach incident. This year, companies with data breaches involving less than 10,000 records spent an average of $4.5 million to resolve the data breach, and those companies with the loss or theft of more than 50,000 records spent $10.3 million.
Figure 8. Average total cost by size of the data breach
The more churn, the higher the per capita cost of data breach. Figure 9 reports the distribution of per capita data breach costs in ascending rate of abnormal churn. Companies that experience less than 1% churn, or a loss of existing customers, had an average total organizational cost of data breach of $5.3 million and those experiencing churn greater than 4% had an average total cost of $10.1 million.
Figure 9. Average total cost by abnormal churn rate
Certain industries are more vulnerable to churn. Figure 10 reports the abnormal churn rate of benchmarked organizations for this year’s study. Although a small sample size prevents us from generalizing the affect of industry on data breach cost, these industry results are consistent with prior years – wherein financial, life science, health and technology organizations experienced a relatively high abnormal churn and public sector, entertainment and communications experienced a relatively low abnormal churn. (Public sector organizations utilize a different churn framework, given that customers of government organizations typically do not have an alternative choice.)
The implication of this analysis is that industries with the highest churn rates could reduce the costs of a data breach by emphasizing customer retention and activities to preserve reputation and brand value.
Figure 10. Abnormal churn rates by industry
Trends in the cost components of a data breach
Detection and escalation costs reach a record high. Figure 11 shows the 12-year trend for such costs as forensic and investigative activities, assessment and audit services, crisis team management and communications to executive management and board of directors. Average detection and escalation costs increased dramatically from $0.73 million in 2016 to $1.07 million in 2017, suggesting that companies are investing more heavily in these activities.
Figure 11. Average detection and escalation costs over 12 years
(in $ million)
Notification costs increase. Figure 12 reports the distribution of costs associated with notification activities. Such costs typically include IT activities associated with the creation of contact databases, determination of all regulatory requirements, engagement of outside experts, postal expenditures, secondary contacts to mail or email bounce-backs and inbound communication set up. This year’s average notification costs increased from $0.59 million in 2016 to $0.69 million in 2017.
Figure 12. Average notification costs over 12 years
(in $ million)
Post data breach costs increase. Figure 13 shows the distribution of costs associated with ex post (after-the-fact) activities. Such costs typically include help-desk activities, inbound communications, special investigative activities, remediation activities, legal expenditures, product discounts, identity protection services and regulatory interventions. Average ex post response costs decreased from $1.72 million in 2016 to $1.56 million in this year’s study.
Figure 13. Average ex post response costs over 12 years
Ex post response costs (in $ million)
Lost business costs increase. Figure 14 reports lost business costs associated with data breach incidents over 12 years. Such costs include abnormal turnover of customers, customer acquisition activities, reputation losses and diminished goodwill. Lost business costs have increased since 2012. The current year’s costs increased from $3.32 million in 2016 to $4.03 million in 2017. The highest level of lost business cost was $4.59 million in 2009.
Figure 14. Average lost business costs over 12 years
Lost business costs (in $ million)
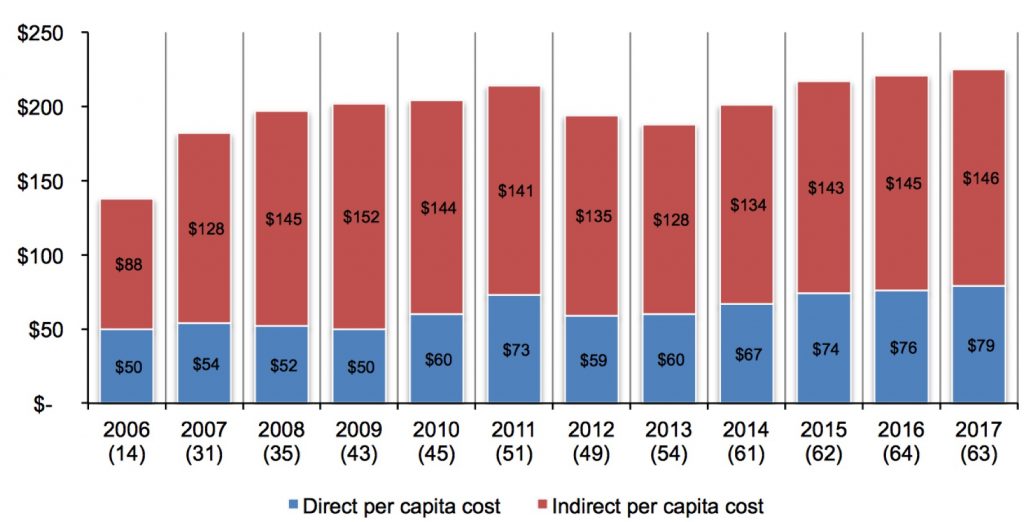
Companies continue to spend more on indirect per capita costs than direct per capita costs. Indirect costs pertain to what the company spends on existing internal resources to deal with the data breach. These costs could include the time employees spend on data breach notification efforts or investigations of the incident. Indirect costs also include the loss of brand value and reputation and customer churn.
Direct costs refer to how much companies spend to minimize the consequences of a data breach and assist victims. These costs include engaging forensic experts to help investigate the data breach, hiring a law firm and offering victims identity protection services.
Figure 15 reports the direct and indirect cost components of a data breach on a per capita basis. The cost of data breach per compromised record increased $4, from $221 in 2016 to $225 in 2017. Indirect and direct costs both increased by $1 and $3 per compromised record, respectively.
Figure 15. Trends in the direct and indirect costs over the past 12 years
The time to identify and contain a data breach affects costs
The faster the time to identify and contain a data breach, the lower the cost. The MTTI and MTTC metrics are used to determine the effectiveness of their organization’s incident response and containment processes. The MTTI metric helps organizations to understand the time it takes to detect that an incident has occurred, and the MTTC metric measures the time it takes for a responder to resolve a situation and ultimately restore service.
As shown in Figure 16, it took an average of more than six months to detect the incident and an average of 55 days or almost two months to contain it.
Figure 16. Days to identify and contain the data breach
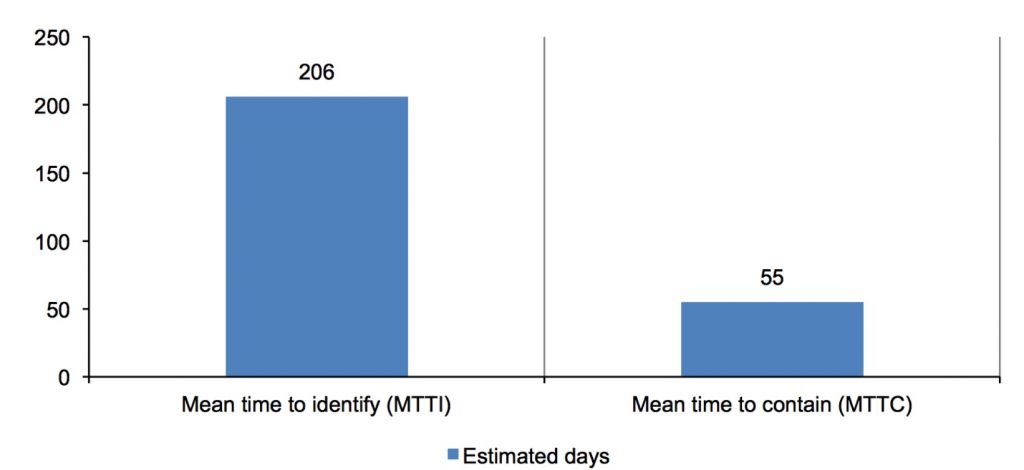
Figure 17 highlights the importance of having an incident response plan in place. If the MTTI was less than 100 days, the average cost to identify the data breach was $5.99 million. However, if the MTTI is greater than 100 days, the average cost increased to $8.70 million.
Figure 17. Relationship between mean time to identify and average total cost
(in $ million)
Similarly, if the time it took to contain the breach was less than 30 days, the cost to contain the breach was $5.87 million. If it took 30 days or longer to contain the breach, the cost increased to $8.83 million, as shown in Figure 18.
Figure 18. Mean time to contain and average total cost
(in $ million)
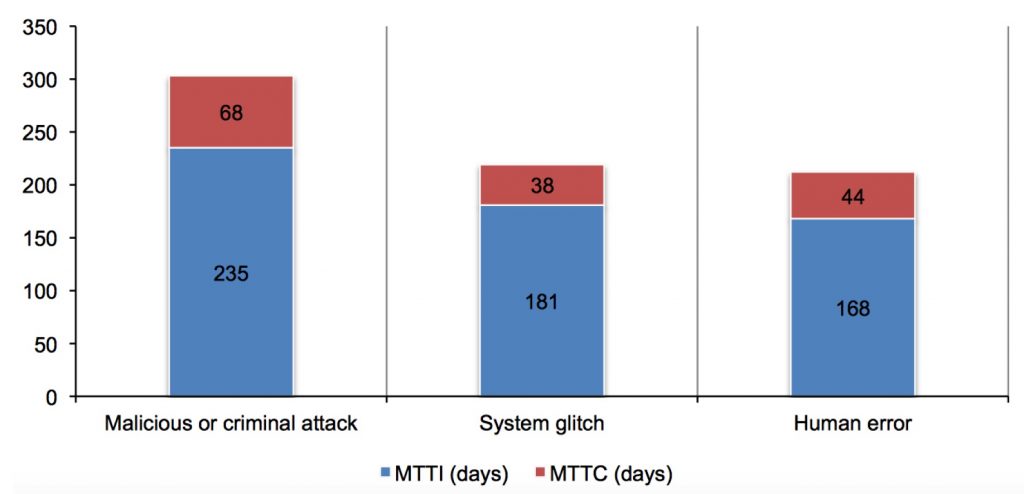
The most difficult and time-consuming incident to detect and contain the data breach, as shown in Figure 19, was a malicious or criminal attack at 303 days. Data breaches caused by system glitches (219 days) and human error (212 days) took less time to identify and contain.
Figure 19. Days to identify and contain the data breach by root cause
Trends in practices to reduce the risk and consequences of a data breach
Organizations reported higher costs to respond to and remediate a data breach. This increase can be attributed to investing in detection and escalation activities and lost business. The most profitable investments are: incident response plans, extensive use of encryption, participation in threat intelligence sharing, employee training and data loss prevention technologies.
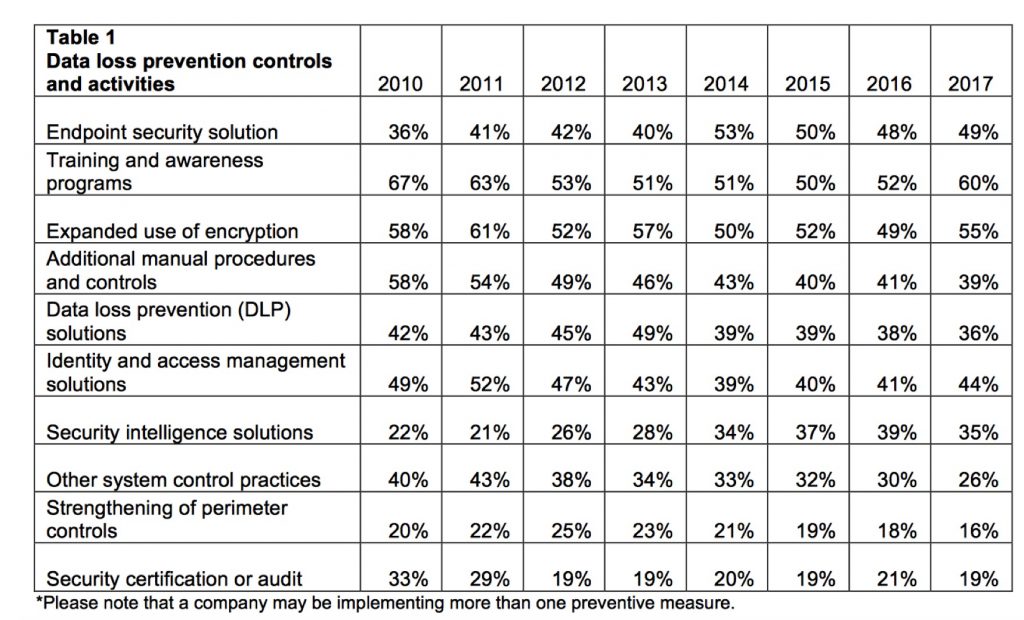
Table 1 reports the preventive measures organizations implemented after the data breach. The most popular measures and controls implemented after the data breach have been fairly consistent. This year, the number-one activity is training (60%) followed by expanded use of encryption (55%) and endpoint security solutions (49%).
Since 2010, the most significant increases in preventive measures are endpoint security solutions (+13%) and security intelligence solutions (+13%). All other data loss prevention controls have decreased over this eight-year period.
Trends in practices to reduce the risk and consequences of a data breach
Organizations reported higher costs to respond to and remediate a data breach. This increase can be attributed to investing in detection and escalation activities and lost business. The most profitable investments are: incident response plans, extensive use of encryption, participation in threat intelligence sharing, employee training and data loss prevention technologies.
Table 1 reports the preventive measures organizations implemented after the data breach. The most popular measures and controls implemented after the data breach have been fairly consistent. This year, the number-one activity is training (60%) followed by expanded use of encryption (55%) and endpoint security solutions (49%).
Since 2010, the most significant increases in preventive measures are endpoint security solutions (+13%) and security intelligence solutions (+13%). All other data loss prevention controls have decreased over this eight-year period.
Part 3. How We Calculate the Cost of Data Breach
To calculate the cost of data breach, we use a costing methodology called activity-based costing (ABC). This methodology identifies activities and assigns a cost according to actual use. Companies participating in this benchmark research are asked to estimate the cost for all the activities in which they engage to resolve a data breach.
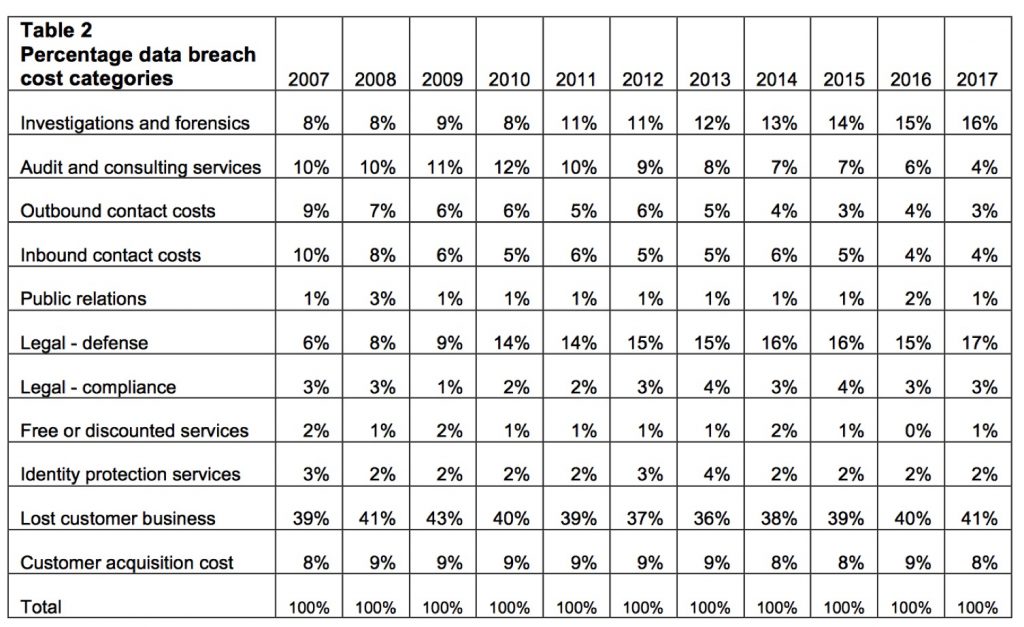
Typical activities for discovery and the immediate response to the data breach include the following:
. Conducting investigations and forensics to determine the root cause of the data breach
. Determining the probable victims of the data breach
. Organizing the incident response team
. Conducting communication and public relations outreach
. Preparing notice documents and other required disclosures to data breach victims and regulators
. Implementing call center procedures and specialized training
The following are typical activities conducted in the aftermath of discovery:
. Audit and consulting services
. Legal services for defense
. Legal services for compliance
. Free or discounted services offered to victims of the breach ! Identity protection services
. Lost customer business based on calculating customer churn or turnover.
. Customer acquisition and loyalty program costs
Once the company estimates a cost range for these activities, we categorize the costs as direct, indirect and opportunity, as defined below:
. Direct cost – the direct expense outlay to accomplish a given activity.
. Indirect cost – the amount of time, effort and other organizational resources spent, though not as a direct cash outlay.
. Opportunity cost – the cost resulting from lost business opportunities as a consequence of negative reputation effects after the breach has been reported to victims (and publicly revealed to the media).
Our study also looks at the core process-related activities that drive a range of expenditures associated with an organization’s data breach detection, response, containment and remediation. The costs for each activity are presented in the Key Findings section (Part 2).
The four cost centers are as follows:
. Detection or discovery: Activities that enable a company to reasonably detect the breach of personal data either at risk (in storage) or in motion.
. Escalation: Activities necessary to report the breach of protected information to appropriate personnel within a specified time period.
. Notification: Activities that enable the company to notify data subjects with a letter, outbound telephone call, e-mail or general notice that personal information was lost or stolen.
. Post data breach: Communication with victims of a breach to help them minimize potential harms and other assistance such as credit report monitoring or reestablishing a new account or credit card.
In addition to the above process-related activities, most companies experience opportunity costs associated with the breach incident. These costs result from present and future customers’ diminished trust or confidence. Accordingly, Ponemon Institute’s research shows that the negative publicity associated with a data breach incident causes reputation effects that may result in abnormal turnover or churn rates and a diminished rate for new customer acquisitions.
To extrapolate these opportunity costs, we use a cost estimation method that relies on the ‘lifetime value’ of an average customer as defined for each participating organization.
. Turnover of existing customers: The estimated number of customers who will most likely terminate their relationship as a result of the breach incident. The incremental loss is abnormal turnover attributable to the breach incident. This number is an annual percentage, based on estimates provided by management during the benchmark interview process. (In several instances, turnover is partial, as in cases when breach victims continued their relationship with the breached organization, but the volume of customer activity actually declines. This partial decline is especially salient in certain industries – such as financial services or public sector entities – where termination is costly or economically infeasible.)
. Diminished customer acquisition: The estimated number of target customers who will not have a relationship with the organization as a consequence of the breach. This number is provided as an annual percentage.
We acknowledge that the loss of non-customer data, such as employee records, may not impact an organization’s churn or turnover. (In this study, we consider citizen, patient and student information as customer data.) In these cases, we expect the business cost category to be lower when data breaches do not involve customer or consumer data (including transactional payment information).
Part 4. Organizational characteristics and benchmark methods
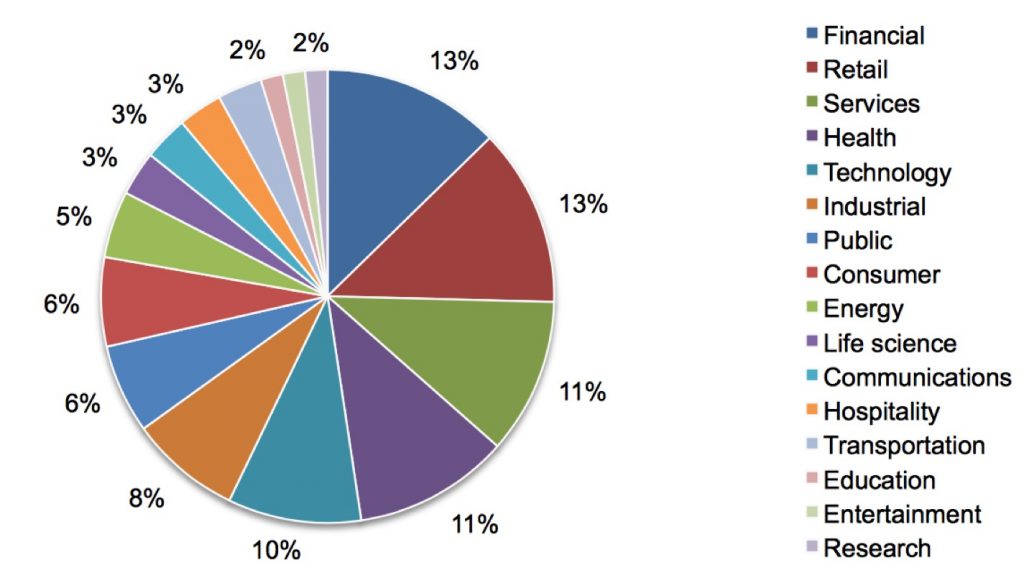
Figure 20 shows the distribution of benchmark organizations by their primary industry classification. In this year’s study, 16 industries were represented. The largest sector was financial services, which includes banks, insurance, investment management and payment processors followed by retail, health and services.
Figure 20. Distribution of the benchmark sample by industry segment
All participating organizations experienced one or more data breach incidents sometime over the past year, requiring notification according to U.S. state laws. Our benchmark instrument captured descriptive information from IT, compliance and information security practitioners about the full cost impact of a breach involving the loss or theft of customer or consumer information. It also required these practitioners to estimate opportunity costs associated with program activities.
Estimated data breach cost components were captured on a rating form. In most cases, the researcher conducted follow-up interviews to obtain additional facts, including estimated abnormal churn rates that resulted from the company’s most recent breach event involving 1,000 or more compromised records. (Our sampling criteria only included companies experiencing a data breach between 1,000 and 100,000 lost or stolen records sometime during the past 12 months. We excluded catastrophic data breach incidents to avoid skewing overall sample findings.)
Data collection methods did not include actual accounting information but instead relied upon numerical estimation based on the knowledge and experience of each participant. The benchmark instrument required individuals to rate direct cost estimates for each cost category by marking a range variable defined in the following number-line format.
How to use the number line: The number line provided under each data breach cost category is one way to obtain your best estimate for the sum of cash outlays, labor and overhead incurred. Please mark only one point somewhere between the lower and upper limits set above. You can reset the lower and upper limits of the number line at any time during the interview process.
Post your estimate of direct costs here for [presented cost category]
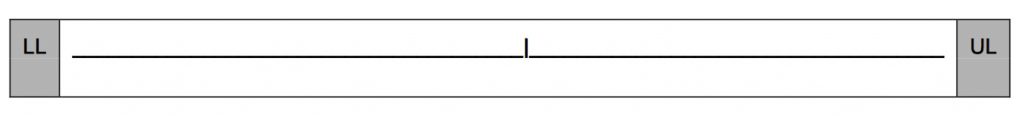
The numerical value obtained from the number line rather than a point estimate for each cost category presented preserved confidentiality and ensured a higher response rate. The benchmark instrument also required practitioners to provide a second estimate for indirect and opportunity costs separately.
To keep the benchmarking process to a manageable size, we carefully limited items to only those cost activity centers that we considered crucial to data breach cost measurement. Based upon discussions with learned experts, the final set of items included a fixed set of cost activities. Upon collection of the benchmark information, each instrument was re-examined carefully for consistency and completeness.
For purposes of complete confidentiality, the benchmark instrument did not capture any company-specific information. Subject materials contained no tracking codes or other methods that could link responses to participating companies.
The scope of data breach cost items contained within our benchmark instrument was limited to known cost categories that applied to a broad set of business operations that handle personal information. We believed that a study focused on business process – and not data protection or privacy compliance activities – would yield better quality results.
Part 5. Limitations
Our study utilizes a confidential and proprietary benchmark method that has been successfully deployed in earlier research. However, inherent limitations with this benchmark research need to be carefully considered before drawing conclusions from findings.
. Non-statistical results: Our study draws upon a representative, non-statistical sample of U.S.- based entities that experienced a breach involving the loss or theft of customer or consumer records during the past 12 months. Statistical inferences, margins of error and confidence intervals cannot be applied to these data given that our sampling methods are not scientific.
. Non-response: The current findings are based on a small representative sample of benchmarks. Sixty-three companies completed the benchmark process. Non-response bias was not tested so it is always possible that companies that did not participate are substantially different in terms of underlying data breach cost.
. Sampling-frame bias: Because our sampling frame is judgmental, the quality of the results is influenced by the degree to which the frame is representative of the population of companies being studied. We believe that the current sampling frame is biased toward companies with more mature privacy or information security programs.
. Company-specific information: The benchmark information is sensitive and confidential. Thus, the current instrument does not capture company-identifying information. It also allows individuals to use categorical response variables to disclose demographic information about the company and industry category.
. Unmeasured factors: To keep the interview script concise and focused, we decided to omitted other important variables from our analyses such as leading trends and organizational characteristics. The extent to which omitted variables might explain benchmark results cannot be determined.
. Extrapolated cost results: The quality of benchmark research is based on the integrity of confidential responses respondents in participating companies provided. Although certain checks and balances can be incorporated into the benchmark process, the possibility exists that respondents did not provide accurate or truthful responses. In addition, the use of cost extrapolation methods rather than actual cost data may inadvertently introduce bias and inaccuracies.


 Subscribe to our free daily newsletter

