


NetApp: Fiscal 2Q18 Financial Results
All-flash array annualized revenue run rate of $1.7 billion, up 58% Y/Y
This is a Press Release edited by StorageNewsletter.com on November 16, 2017 at 2:31 pm| (in $ million) | 2Q17 | 2Q18 | 6 mo. 17 | 6 mo. 18 |
| Revenue | 1,340 | 1,422 | 2,634 | 2,747 |
| Growth | 6% | 4% | ||
| Net income (loss) | 109 | 175 | 173 | 311 |
NetApp, Inc. reported financial results for the second quarter fiscal year 2018, ended October 27, 2017.
“In the second quarter, NetApp again delivered strong operating results on the top and bottom lines. We also introduced a number of industry-leading innovations that position us for continued growth and expand our leadership position in the growth segments of the market,” said George Kurian, CEO. “Our strong performance was driven by excellent execution and reflects our customers’ clear and growing preference for the value of our Data Fabric strategy. We are winning because we enable our customers’ success through data.”
Second Quarter Fiscal 2018 Financial Results
- Net Revenues: $1.42 billion, increased 6% year-over-year from $1.34 billion in the second quarter of fiscal 2017
- Net Income: GAAP net income of $175 million, compared to GAAP net income of $109 million in the second quarter of fiscal 2017; non-GAAP net income1 of $223 million, compared to non-GAAP net income of $169 million in the second quarter of fiscal 2017
- Earnings per Share: GAAP earnings per share of $0.64, compared to GAAP earnings per share of $0.38 in the second quarter of fiscal 2017; non-GAAP earnings per share of $0.81, compared to non-GAAP earnings per share of $0.60 in the second quarter of fiscal 2017
- Cash, Cash Equivalents and Investments: $6.0 billion at the end of the second quarter fiscal year 2018
- Cash from Operations: $314 million, compared to $158 million in the second quarter of fiscal 2017
- Share Repurchase and Dividend: Returned $204 million to shareholders through share repurchases and a cash dividend
The company provided guidance for 3FQ18:
- Net revenues are expected to be in the range of $1.425 billion to $1.575 billion
- Earnings per share is expected to be in the range of:
- $1.18-$1.26*
- $0.86-$0.94
*GAAP earnings per share includes an expected $0.50 per share benefit, after tax, from gains on the sale of certain properties.
Next cash dividend of $0.20 per share to be paid on January 24, 2018, to shareholders of record as of the close of business on January 5, 2018
Second Quarter Fiscal 2018 Business Highlights
New Solutions Expand NetApp Impact in Flash, Next-Generation Data Center, and Cloud
- EF570 all-flash system is the storage industry’s price/performance leader as demonstrated by SPC-1 and SPC-2 benchmark tests.
- E5700 Series hybrid flash system accelerates performance and increases density with a hybrid flash system optimal for modern enterprise applications.
- SANtricity Cloud Connector enables Data Fabric capabilities by providing cost-effective backup and recovery to the cloud from NetApp E-Series and EF-Series systems.
- SANtricity 11.4 software now comes with security enhancements such as role-based access control and audit log, Active Directory support, and an external key manager.
- Converged Infrastructure Solution for Data Analytics brings together the latest storage, networking, and server technologies to help simplify deployment of data analytics environments.
- Introduces new AI-enabled virtual support assistant, Elio, and Active IQ cloud-based analytics to help companies gain intelligent insights.
- Expands collaboration with Microsoft Azure to deliver the industry’s first Azure enterprise NFS service.
- SolidFire Element OS 10 supports data movement from Element OS systems to ONTAP systems across the Data Fabric and helps customers align IT service levels to business goals.
- HCI, built on SolidFire Element OS, the world’s first enterprise-scale hyper converged solution, became available in October 2017.
- StorageGRID Webscale 11 simplifies the creation of next-generation data center cloud architecture by enabling easy implementation of hybrid cloud data pipelines with AWS.
- ONTAP 9.3 software offers 40% increased performance over earlier versions, further optimizes deduplication, and enhances security and compliance.
- OnCommand Insight updated with new cloud cost monitoring provides a complete picture of IT infrastructure.
NetApp Enables Customers to Improve Their Performance Through Cloud and Flash Services
- SolidFire enables Ensono to deliver more value with fewer resources allowing their clients to focus on accelerating their businesses and leave the burden of managing IT to Ensono.
- Data Fabric solutions allow Renown Health to reduce downtime and performance concerns, while enabling the integrated healthcare network to deliver services and care to more patients.
- CloudOps leverages SolidFire as the storage foundation for CloudMC, the IaaS platform that enables users such as cloud.ca to rapidly grow secure, cloud-based businesses.
- Healthix enlists as a strategic partner to build a nondisruptive solution for sharing patient data among unrelated healthcare organizations, while remaining compliant with patient privacy laws and regulations.
Comments
Revenue at $1,422 million, up 7% Q/Q and 6% Y/Y, beats the consensus estimate of $1,380 billion, and is the best figure since 4FQ17. Gross margin, operating margin, and earnings per share were all above guidance.
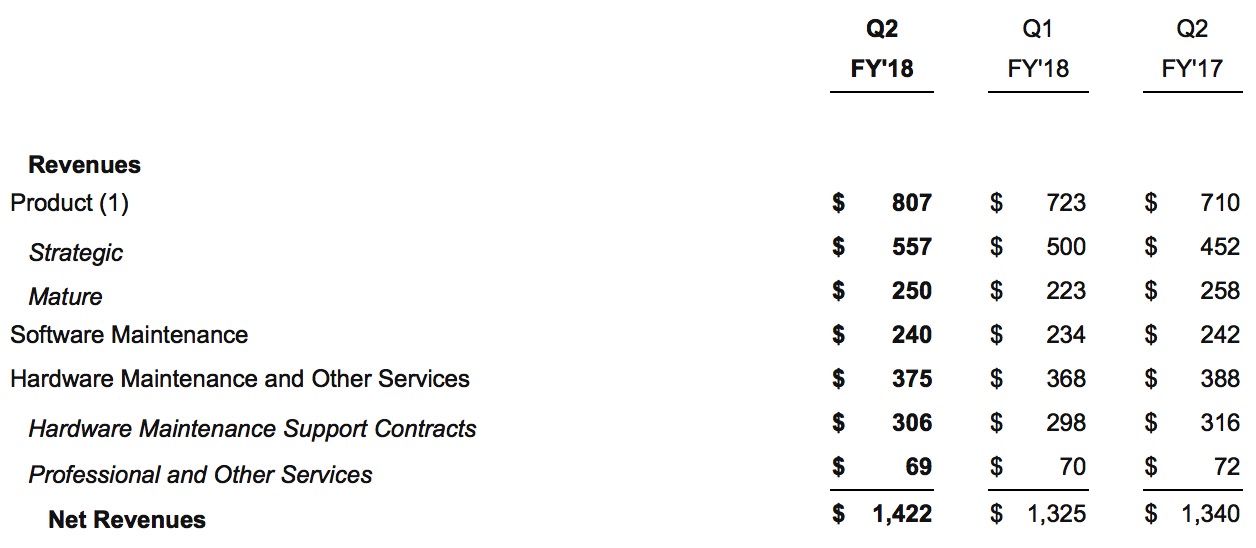
Product revenue of $807 million increased 14% Y/Y marks the fourth consecutive quarter of year-over-year growth.
In the second quarter, product revenue from mature solutions declined 3% Y/Y.
The transition from 7-mode to Clustered ONTAP has ended.
The strategic direction to all-flash arrays, converged and hyper-converged infrastructure and hybrid cloud is successful with 69% of net product revenue in 2FQ18, up 23% Y/Y.
The percentage of installed base on solid-state is about 10% now.
Concerning supply, CFO Ronald J. Pasek said: "We do have adequate supply for both SSDs and DRAM, by the way. Definitely more of a headwind on the DRAM pricing, that's definitely something everyone's suffering from right now, but moderated increases on SSDs. I think what we're seeing now is it's widely anticipated sometime in the first half of the next calendar year, we should see supply free up."
The combination of software maintenance and hardware maintenance and other services revenues of $615 million declined 2% year-over-year and increased 2% sequentially.
America represents 56% of sales, EMEA 30% and AsiaPac 14%, with pathways mix of 22% direct and 78% indirect.
Guidance for revenue in next quarter, at the midpoint, implies a 6.8% increase year-over-year.
Company is not providing guidance for FY19 and continues to expect year-over-year growth rate for sales to accelerate in the second half of the year. It expect mid-single-digit revenue growth this fiscal year.
| Period | Revenue* | Y/Y Growth | Net income (loss)* |
| 1FQ14 | 1,516 | 5% | 82 |
| 2FQ14 | 1,550 | 1% | 167 |
| 3FQ14 | 1,610 | -1% | 192 |
| 4FQ14 | 1,649 | -4% | 197 |
| FY14 | 6,325 | -0% | 638 |
| 1FQ15 | 1,489 | -2% | 88 |
| 2FQ15 | 1,542 | -0% | 160 |
| 3FQ15 | 1,551 | -4% | 177 |
| 4FQ15 | 1,540 | -2% | 135 |
| FY15 | 6,123 | -3% | 560 |
| 1FQ16 | 1,335 | -10% | (30) |
| 2FQ16 | 1,445 | -9% | 114 |
| 3FQ16 | 1,386 | -11% | 153 |
| 4FQ16 | 1,380 | -10% | (8) |
| FY16 | 5,546 | -9% | 229 |
| 1FQ17 | 1,294 | -3% | 64 |
| 2FQ17 | 1,340 | -7% | 109 |
| 3FQ17 | 1,404 | 1% | 146 |
| 4FQ17 | 1,481 | 7% | 190 |
| FY17 | 5,519 | -0% | 509 |
| 1FQ18 | 1,325 | 2% | 136 |
| 2FQ18 | 1,422 | 6% | 175 |
* in $ million
To read the earnings call transcript


 Subscribe to our free daily newsletter

