


NetApp: Fiscal 1Q18 Financial Results
Company continues to grow slowly with revenue up 2% Y/Y and down 11% Q/Q.
This is a Press Release edited by StorageNewsletter.com on August 17, 2017 at 3:02 pm| (in $ million) | 1Q17 | 1Q18 | Growth |
| Revenue |
1,294 | 1,325 | 2% |
| Net income (loss) | 64 | 136 |
• Net revenues of $1.33 billion; Up 2% year-over-year
• Product revenue increased 10% year-over-year.
• All-flash array annualized net revenue run rate grew 95% Y/Y.
• GAAP EPS of $0.49 and non-GAAP EPS of $0.62; up Y/Y 113% and 35%, respectively.
NetApp, Inc. reported financial results for the first quarter fiscal year 2018, ended July 28, 2017.
First Quarter Financial Results
Net revenues for the first quarter of fiscal year 2018 were $1.33 billion, compared to net revenues of $1.29 billion for the comparable period of the prior year.
GAAP net income for the first quarter of fiscal year 2018 was $136 million, or $0.49 per share, compared to GAAP net income of $64 million, or $0.23 per share, for the comparable period of the prior year.
Non-GAAP net income for the first quarter of fiscal year 2018 was $173 million, or $0.62 per share, compared to non-GAAP net income of $129 million, or $0.46 per share, for the comparable period of the prior year.
Cash, Cash Equivalents and Investments
NetApp ended the first quarter of fiscal year 2018 with $5.3 billion in total cash, cash equivalents and investments. During the first quarter of fiscal year 2018, the company generated $250 million in cash from operations and returned $204 million to shareholders through share repurchases and a cash dividend.
The company announced the next cash dividend of $0.20 per share. The quarterly dividend will be paid on October 25, 2017, to shareholders of record as of the close of business on October 6, 2017.
“We delivered strong Q1 results across the board and continued to introduce substantial innovation. We are strengthening our leadership position by enhancing our all flash array and converged infrastructure offerings, and augmenting our Data Fabric strategy,” said George Kurian, CEO. “Customers and industry leaders are excited by our strategic direction and are choosing NetApp as their partner for data-driven digital transformations. We are building on a strong foundation and are, without question, the best positioned and the best executing company in the industry.“
Q2 Fiscal Year 2018 Outlook
Net revenues are expected to be in the range of $1.31 billion to $1.46 billion
Earnings per share is expected to be in the range of:
- GAAP: $0.47 – $0.55
- Non-GAAP: $0.64 – $0.72
Business Highlights
NetApp expands service provider programs and alliances, leads a new IT category, and delivers innovations
- Expanded Fueled by NetApp Program helps service providers gain access to new consulting and incubator programs, as well as new efficiency guarantees and increased training.
- Recognized as a Leader in Gartner Magic Quadrant for Solid-State Arrays.
- New FlexPod SF converged infrastructure solution offers infrastructure for the data-intensive scale-out workloads that are critical to digital transformation.
- Positioned to capture digital transformation opportunity with leadership in new IDC category of hybrid cloud data services.
- Expands collaboration with Microsoft Azure in hybrid cloud data services to deliver enterprise-grade visibility and insights, data access and control, as well as data protection and security for customers moving to Microsoft Azure.
- Provided early access to the innovations of NetApp HCI, planned to be available in the second half of calendar 2017, to a number of technology partners that are integrating with the solution.
- ONTAP select software-defined storage is optimized for new use cases, including a new remote office/branch office solution and enterprise NAS services in more diverse storage environments.
- OnCommand Insight (OCI) adds new functions to ease hybrid cloud migration and optimize hybrid cloud resources with accurate workload placement and resizing.
- ONTAP enhancements include the new FabricPool feature for automatic and transparent tiering of inactive data to the cloud; expanded inline deduplication across multiple pools of storage to increase storage efficiency; and new performance controls, including QoS minimum and intelligent data placement.
- With NextCredit, introduces a flexible future credit program, allowing customers to upgrade or build out their Data Fabric with new technologies and capabilities as they become available.
- StorageGRID Webscale next-generation object storage software simplifies OpenStack storage deployments and supports Docker container deployment on bare-metal servers.
- SnapCenter 3.0 enables customers to restore and recover SAP HANA multitenant database containers.
Comments
For the third time after 13 consecutive quarters in a row, revenue is growing Y/Y for 1FQ18, by only 2% (and -11% Q/Q) at $1.33 billion, but beating Street forecasts.
Revenue was above the midpoint of company's guidance range, and gross margin, operating margin and earnings per share were above guidance.
Net income at $136 million is down 28% Q/Q and more than doubling Y/Y.
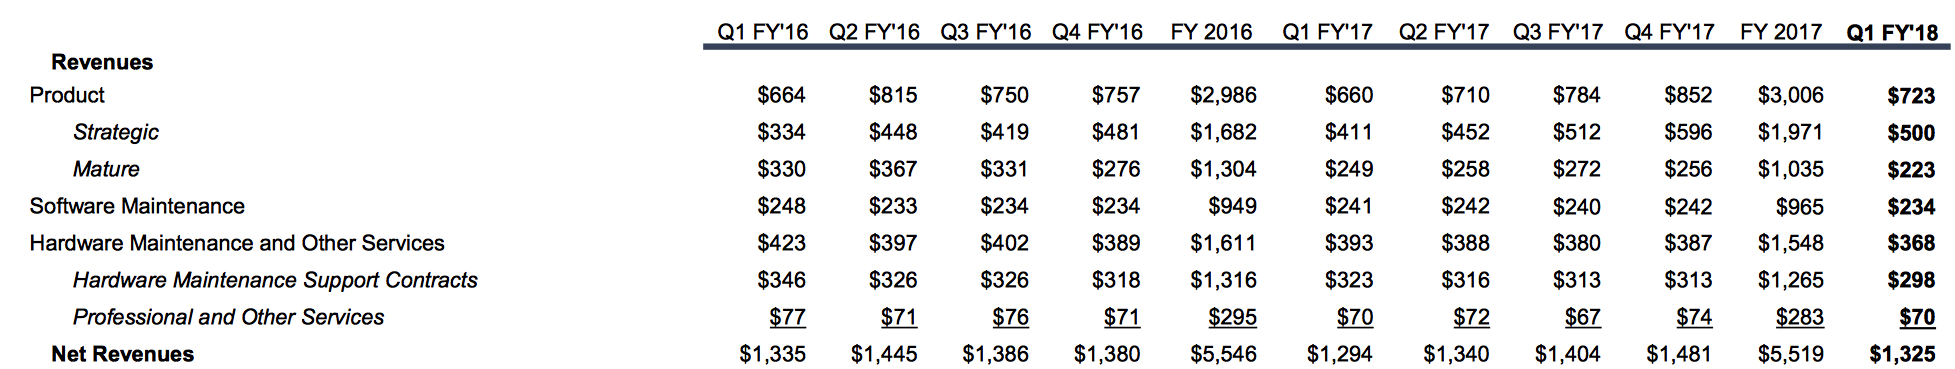
Product revenue of $723 million increased yearly 10%. This was the third consecutive quarter of year-over-year product revenue growth, driven by the successful pivot to the growth areas of the market.
The combination of software maintenance and hardware maintenance and other services revenues of $602 million were down 5% year-over-year. This decline was driven by the following factors: changes made to the service pricing several years ago, renewal execution issues in FY17 and several years of product revenue declines.
NetApp has already transitioned its business away from the declining segments to the data-driven high-growth segments of all-flash arrays, converged infrastructure and hybrid cloud. It will further expand this opportunity with the general availability of hyper-converged solution later this calendar year.
In the most recent quarter, all-flash array business, inclusive of All Flash FAS, EF and SolidFire product and services, grew 95% Y/Y to an annualized net revenue run rate of $1.5 billion.
Click to enlarge
For 2FQ18 the storage firm is forecasting a revenue range $1.31 billion to $1.46 billion or -1% to 10% Q/Q respectively, and, at the midpoint, implies approximately 4.5% growth sequentially, and 3.4% growth yearly.
| Period | Revenue* | Y/Y Growth | Net income (loss)* |
| 1FQ14 | 1,516 | 5% | 82 |
| 2FQ14 | 1,550 | 1% | 167 |
| 3FQ14 | 1,610 | -1% | 192 |
| 4FQ14 | 1,649 | -4% | 197 |
| FY14 | 6,325 | -0% | 638 |
| 1FQ15 | 1,489 | -2% | 88 |
| 2FQ15 | 1,542 | -0% | 160 |
| 3FQ15 | 1,551 | -4% | 177 |
| 4FQ15 | 1,540 | -2% | 135 |
| FY15 | 6,123 | -3% | 560 |
| 1FQ16 | 1,335 | -10% | (30) |
| 2FQ16 | 1,445 | -9% | 114 |
| 3FQ16 | 1,386 | -11% | 153 |
| 4FQ16 | 1,380 | -10% | (8) |
| FY16 | 5,546 | -9% | 229 |
| 1FQ17 | 1,294 | -3% | 64 |
| 2FQ17 | 1,340 | -7% | 109 |
| 3FQ17 | 1,404 | 1% | 146 |
| 4FQ17 | 1,481 | 7% | 190 |
| FY17 | 5,519 | -0% | 509 |
| 1Q18 | 1,325 | 2% | 136 |
* in $ million
To read the earnings call transcript


 Subscribe to our free daily newsletter

