


4TB Toshiba and 8TB HGST HDDs Run Through 2016 Without Single Failure – Backblaze
But Seagate 4TB units with 14% failure rate
This is a Press Release edited by StorageNewsletter.com on February 2, 2017 at 2:40 pm This article, Backblaze HDD Stats for 2016, was published on a blog of Backblaze, Inc., written by Andy Klein
Backblaze has recorded and saved daily HDD statistics from the drives in its data centers since April 2013.
At the end of 2016 we had 73,653 spinning HDDs. Of that number, there were 1,553 boot drives and 72,100 data drives.
This post looks at the HDD statistics of the data drives we monitor. We’ll first look at the stats for Q4 2016, then present the data for all of 2016, and finish with the lifetime statistics for all of the drives Backblaze has used in its cloud storage data centers since it started keeping track. Along the way we’ll share observations and insights on the data presented.
HDD Reliability Statistics for Q4 2016
At the end of Q4 2016 the company was monitoring 72,100 data drives. For our evaluation we remove from consideration those drives which were used for testing purposes and those drive models for which we did not have at least 45 drives. This leaves us with 71,939 production HDDs.
HDD Annualized Failure Rates for 4Q16
(reporting period 10/1/20 – 12/31/2016 inclusive)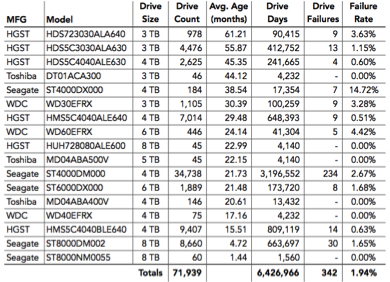
Notes:
1 The failure rate listed is for just Q4 2016. If a drive model has a failure rate of 0%, it means there were no drive failures of that model during that quarter.
2 90 drives (2 storage pods) were used for testing purposes during the period. They contained Seagate 1.5TB and 1TB WDC drives. These are not included in the results above.
3 The most common reason we have less than 45 drives of one model is that we needed to replace a failed drive, but that drive model is no longer available. We use 45 drives as the minimum number to report quarterly and yearly statistics.
8TB HDD Performance
In Q4 2016 we introduced a third 8TB drive model, the Seagate ST8000NM0055. This is an enterprise drive. One 60-drive Storage Pod was deployed mid-Q4 and the initial results look promising as there have been no failures to date. Given our past disdain for overpaying for enterprise drives, it will be interesting to see how these drives perform.
We added 3,540 Seagate 8TB drives, model ST8000DM002, giving us 8,660 of these drives. That’s 69PB of raw storage, before formatting and encoding, or about 22% of our current storage capacity. The failure rate for the quarter of these 8TB drives was a very respectable 1.65%. That’s lower than the Q4 failure rate of 1.94% for all of the HDDs in the table above.
During the next couple of calendar quarters we’ll monitor how the new enterprise 8TB drives compare to the consumer 8TB drives. We’re interested to know which models deliver the best value and we bet you are too. We’ll let you know what we find.
2016 HDD Performance Statistics
Looking back over 2016, we added 15,646 HDDs, and migrated 110 Storage Pods (4,950 drives) from 1, 1.5, and 2TB drives to 4, 6 and 8TB drives. Below are the HDD failure stats for 2016. As with the quarterly results, we have removed any non-production drives and any models that had less than 45 drives.
HDD Annualized Failure Rates for 4Q16
(reporting period 10/1/20 – 12/31/2016 inclusive)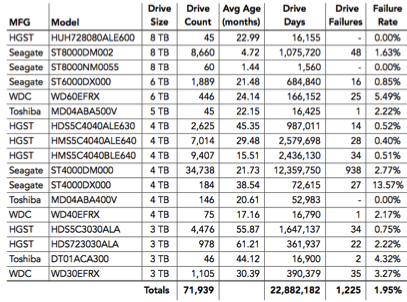
No Time For Failure
In 2016, three drives models ended the year with zero failures, albeit with a small number of drives. Both the 4TB Toshiba and the 8TB HGST models went the entire year without a drive failure. The 8TB Seagate (ST8000NM0055) drives, which were deployed in November 2016, also recorded no failures.
The total number of failed drives was 1,225 for the year. That’s 3.36 drive failures per day or about 5 drives per workday, a very manageable workload. Of course, that’s easy for me to say, since I am not the one swapping out drives.
The overall HDD failure rate for 2016 was 1.95%. That’s down from 2.47% in 2015 and well below the 6.39% failure rate for 2014.
Big Drives Rule
We increased storage density by moving to higher-capacity drives. That helped us end 2016 with 3TB drives being the smallest density drives in our data centers. During 2017, we will begin migrating from the 3TB drives to larger-sized drives. Here’s the distribution of our HDDs in our data centers by size for 2016.
2016 Distribution of HDDs by Size
(Blackblaze data centers as of 12/31/016, less than 1% are the 5TB drives)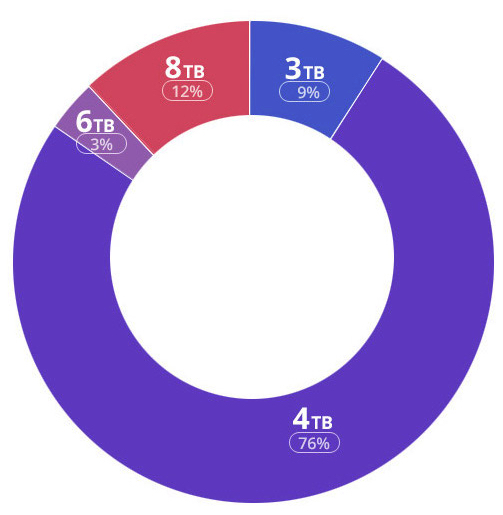
Digging in a little further, below are the failure rates by drive size and vendor for 2016.
HDDs Failure Rates by Drive Size
(for 2016 as of 12/31/2016)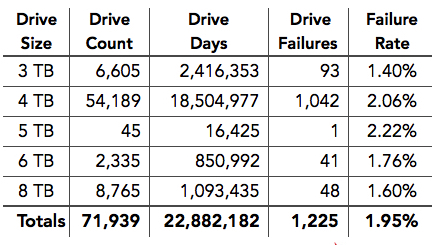
HDDs Failure Rates by Manufacturer
(for 2016 as of 12/31/2016)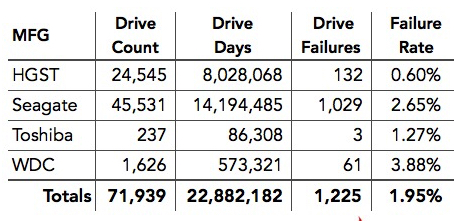
Computing the Failure Rate
Failure rate, in the context we use it, is more accurately described as the annualized failure rate. It is computed based on drive days and drive failures, not on the drive count. This may seem odd given we are looking at a one year period, 2016 in this case, so let’s take a look.
We start by dividing the drive failures by the drive count. For example if we use the statistics for 4TB files, we get a failure rate of 1.92%, but the annualized failure rate shown on the chart for 4TB drives is 2.06%. The trouble with just dividing drive failures by drive count is that the drive count constantly changes over the course of the year. By using drive count from a given day, you assume that each drive contributed the same amount of time over the year, but that’s not the case. Drives enter and leave the system all the time. By counting the number of days each drive is active as drive days, we can account for all the ins and outs over a given period of time.
HDD Benchmark Statistics
As we noted earlier, we’ve been collecting and storing drive stats data since April 2013. In that time we have used 55 different HDD models in our data center for storage. We’ve omitted models from the table below that we didn’t have enough of to populate an entire storage pod (45 or fewer). That excludes 25 of those 55 models.
Annualized HDD Failure Rates
(observation period: April 2013 through December 2016)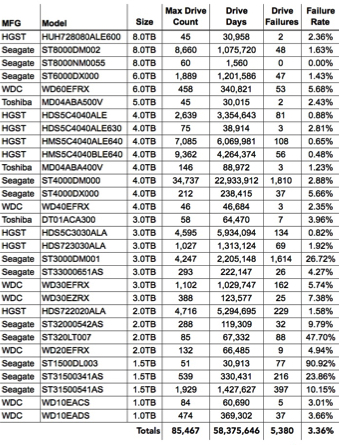
Fun with Numbers
Since April 2013, there have been 5,380 HDDs failures. That works out to about 5 per day or about 7 per workday (200 workdays per year). As a point of reference, Backblaze only had 4,500 total HDDs in June 2010 when we racked our 100th Storage Pod to support our cloud backup service.
The 58,375,646 drive days translates to a little over 1.4 Billion drive hours. Going the other way we are measuring a mere 159,933 years of spinning HDDs.
You’ll also notice that we have used a total of 85,467 HDDs. But at the end of 2016 we had 71,939 HDDs. Are we missing 13,528 HDDs? Not really. While some drives failed, the remaining drives were removed from service due primarily to migrations from smaller to larger drives. The stats from the migrated”drives, like drive hours, still count in establishing a failure rate, but they did not fail, they just stopped reporting data.
Failure Rates Over Time
The chart below shows the annualized failure rates of HDDs by drive size over time. The data points are the rates as of the end of each year shown. The ‘stars’ mark the average annualized failure rate for all of the HDDs for each year.
Annualized HDD Failure Rate by Drive Size
(observation period: April 2013 through December 2016)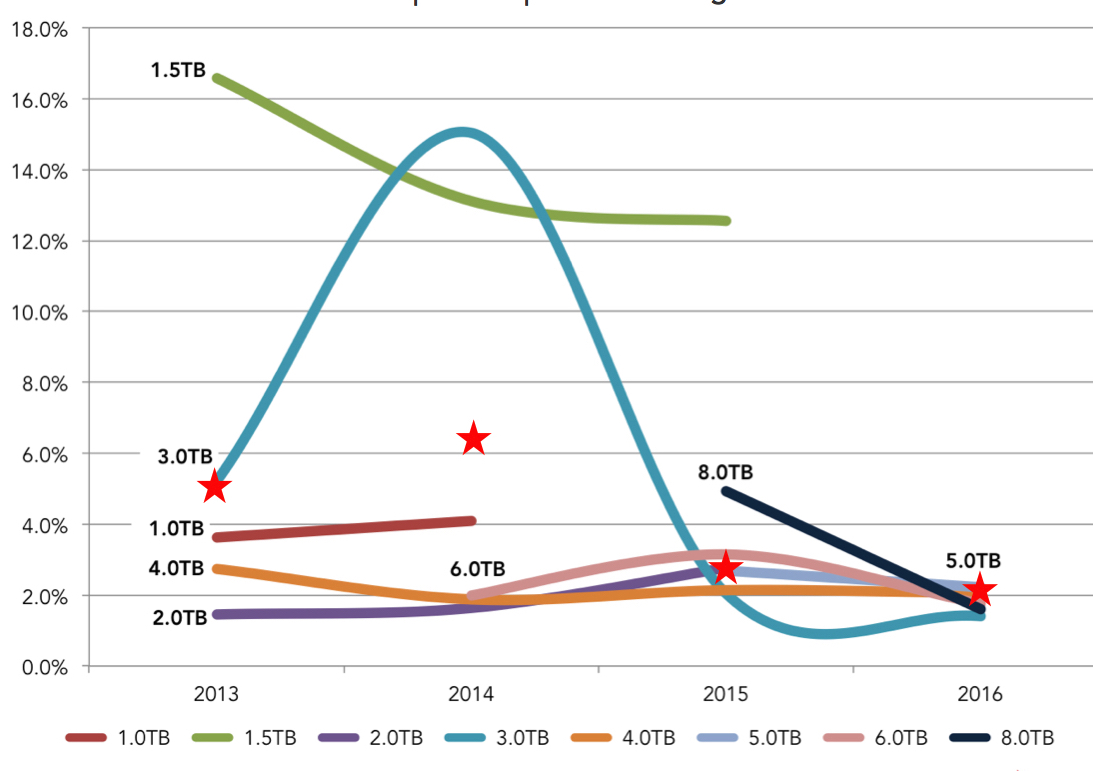
Notes:
1 The 8TB failure rate of 4.9% for 2015 is comprised of 45 drives of which there were 2 failures during that year. In 2016 the number of 8TB drives rose to 8,765 with 48 failures and an annualized failure rate of 1.6%.
2 The 1TB drives were 5+ years old on average when they were retired.
3 There are only 45 of the 5TB drives in operation.


 Subscribe to our free daily newsletter

