


Western Digital: Fiscal 1Q17 Financial Results
Strong demand for HDD and SSD, but recording losses
This is a Press Release edited by StorageNewsletter.com on October 28, 2016 at 2:38 pm| (in $ million) | 1Q16 | 1Q17 | Growth |
| Revenue |
3,360 | 4,714 | 40% |
| Net income (loss) | 283 | (366) |
Western Digital Corp. reported revenue of $4.7 billion, operating income of $232 million and a net loss of $366 million, or $1.28 per share, for its first fiscal quarter ended Sept. 30, 2016.
The GAAP net loss for the period includes charges associated with the company’s recent acquisitions and debt extinguishment charges related to its repricing and repayment of outstanding debt. Excluding these charges and other non-GAAP adjustments, first quarter non-GAAP operating income was $632 million and non-GAAP net income was $341 million, or $1.18 per share.
In the year-ago quarter, the company reported revenue of $3.4 billion, operating income of $322 million and net income of $283 million, or $1.21 per share. Non-GAAP operating income in the year-ago quarter was $405 million and non-GAAP net income was $366 million, or $1.56 per share.
The company generated $440 million in cash from operations during the first fiscal quarter of 2017, ending with total cash and cash equivalents of $4.1 billion. On Aug. 3, 2016, the company declared a cash dividend of $0.50 per share of its common stock, which was paid to shareholders on Oct.17, 2016.
“We are pleased with our performance in the September quarter, the first full quarter as an integrated company following the SanDisk acquisition in May,” said Steve Milligan, CEO. “Demand for both HDD and flash-based products was strong across all customer categories, driven by cloud and mobile applications, as well as better-than-expected PC market trends. We are encouraged by the uniformly positive response to the new Western Digital platform from our broadened customer base.
“The Western Digital team is executing very well against our top business objectives, including the integrations of the legacy HGST, SanDisk and WD operations, and our transition to next-generation NAND technology. We are on track to achieve our synergy goals associated with these integrations and our transition to 3D NAND continues to progress as planned.”
Comments
The large increase in revenue for the quarter at $4.71 billion (up 40% Y/Y, 35% Q/Q) is largely due to the addition of SanDisk but also to strong demand for HDDs and SSDs resulting in sales in excess of its revised outlook.
But the company swings to losses ($366 million), like the former quarter ($351 million).
Concerning HDDs, the firm shipped 47.5 million units, a figure increasing 19% Q/Q and down 8% Y/Y, and even decreasing 17% compared to the same quarter two years go. Quarterly the numbers are up in all categories: enterprise, desktop, CE, branded, and especially notebook drives. ASP of these products at $61 is about the same since three years (varying between $56 and $63.)
Volume and HDD share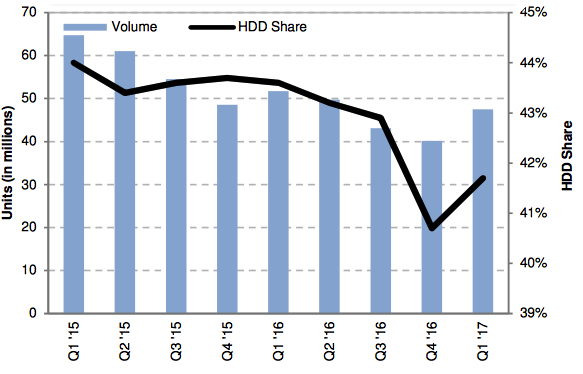
WD didn't reveal any specific figures for SSDs, stating only that the global capacity enterprise HDD and SSD combined reached 28.6EB (+16% Q/Q) and that total HDD and SSD capacity shipped for the quarter was 80EB.
Revenue in datacenter devices and solutions was $1.4 billion, client devices $2.3 billion, and client solutions $1 billion.
The vendor said no more than it expects revenue in next quarter to be flat.
Volume and HDD Share
| WD's HDDs (units in million) |
Enterprise | Desktop | Notebook | CE | Branded | Total HDDs | HDD share | Exabyte Shipped |
Average GB/drive |
ASP |
| 1Q14 | 7.8 | 17.3 | 22.9 | 8.5 | 6.1 | 62.6 | 44.7% | 50.8 | 811 | $58 |
| 2Q14 | 7.8 | 16.8 | 22.7 | 8.8 | 7.0 | 63.1 | 44.4% | 55.1 | 874 | $60 |
| 3Q14 | 7.1 | 16.6 | 21.8 | 8.6 | 6.3 | 60.4 | 43.8% | 53.6 | 888 | $58 |
| 4Q14 | 7.1 | 16.2 | 22.9 | 10.9 | 6.0 | 63.1 | 45.7% | 55.2 | 875 | $56 |
| 1Q15 | 7.8 | 16.3 | 23.4 | 10.5 | 6.8 | 64.7 | 44.0% | 64.9 | 1,002 | $58 |
| 2Q15 | 8.0 | 15.4 | 21.2 | 9.3 | 7.2 | 61.0 | 43.4% | 66.4 | 1,087 | $60 |
| 3Q15 | 7.5 | 13.5 | 18.8 | 8.6 | 6.1 | 54.5 | 43.6% | 61.3 | 1,123 | $61 |
| 4Q15 | 7.2 | 11.6 | 15.5 | 9.1 | 5.2 | 48.5 | 43.7% | 56.2 | 1,159 | $60 |
| 1Q16 | 7.2 | 11.7 | 15.8 | 11.5 | 5.6 | 51.7 | 43.6% | 63.5 | 1,228 | $60 |
| 2Q16 | 7.0 | 12.5 | 15.3 | 8.5 | 6.4 | 49.7 | 43.2% | 69.1 | 1,390 | $61 |
| 3Q16 | 6.4 | 10.7 | 13.6 | 7.3 | 5.2 | 43.1 | 43.2% | 63.7 | 1,443 | $60 |
| 4Q16 | 6.0 | 7.9 | 11.4 | 10.0 | 4.7 | 40.1 | 40.7% | 66.1 | 1,648 | $63 |
| 1Q17 | 6.5 | 9.0 | 14.6 | 12.3 | 5.2 | 47.5 | 41.7% | 80.0* | 1,684 | $61 |
Seagate vs. WD for 1FQ17
(revenue and net income in $ million, units in million)
| Seagate | WD | % in favor of WD |
|
| Revenue | 2,797 | 4,714 | 69% |
| Net income | 167 | (366) | NA |
| Notebook | 6.8 | 14.6 | 115% |
| Desktop | 9.1 | 9.0 | -1% |
| Branded | 4.7 | 5.1 | 9% |
| CE | 9.6 | 12.3 | 28% |
| Enterprise | 8.7 | 6.5 | -25% |
| Total HDDs | 38.9 | 47.5 | 22% |
| Market share | 34.2% | 41.7% | 9% |
| Average GB/drive | 1,716 | 1,684 | NA |
| Exabytes shipped | 67 | 80* | 19% |
| HDD ASP | $67 | $61 | -9% |
*for combined HDDs an SSDs


 Subscribe to our free daily newsletter

