


Violin Memory: Fiscal 2Q17 Financial Results
Worst revenue and continuing huge net loss since 15 former quarters
This is a Press Release edited by StorageNewsletter.com on September 12, 2016 at 3:14 pm| (in $ million) | 2Q16 | 2Q17 | 6 mo. 16 | 6 mo. 17 |
| Revenue | 15.3 | 7.5 | 27.4 | 17.2 |
| Growth | -51% | -47% | ||
| Net income (loss) | (24.4) | (20.6) | (50.9) | (42.7) |
Violin Memory, Inc. announced financial results for the second fiscal quarter ended July 31, 2016.
Second Quarter Fiscal 2017 Financial Highlights
- Second quarter fiscal 2017 revenue of $7.5 million
- Second quarter fiscal 2017 GAAP gross margin of 3%
- Second quarter fiscal 2017 non-GAAP gross margin of 44%
- Second quarter fiscal 2017 GAAP net loss of $0.82 per share
- Second quarter fiscal 2017 non-GAAP net loss of $0.59 per share
“Violin is proactively taking the actions necessary to return the company to growth by leveraging innovation and technology to meet customer needs, while achieving the lowest cost structure in the industry,” said Kevin DeNuccio, president and CEO. “These actions, coupled with expanding flash storage platform customer engagements, will support the company’s effort to attract additional capital to fuel growth through profitability.“
Second Quarter Fiscal 2017 Financial Results
- Revenue was $7.5 million, 23% lower sequentially compared to $9.7 million reported in the first quarter of fiscal 2017, and 51% lower compared to $15.3 million reported in the second quarter of fiscal 2016.
- GAAP gross margin was 3% compared to 40% reported in the first quarter of fiscal 2017 and compared to 43% reported in the second quarter of fiscal year 2016.
- Non-GAAP gross margin was 44% compared to 42% reported in the first quarter of fiscal 2017 and compared to 47% reported in the second quarter of fiscal year 2016.
- GAAP net loss was $20.6 million, or $0.82 per share, compared to first quarter of fiscal 2017 GAAP net loss of $22.2million, or $0.89 per share and compared to second quarter fiscal 2016 GAAP net loss of $24.4 million, or $1.01 per share. All share and per share numbers reflect the company’s 1-for-4 reverse split that occurred on July 6, 2016.
- GAAP net loss included stock-based compensation expense of $3.1 million and an excess and obsolete inventory provision of $2.9 million partially offset by recovery against restructuring charges of $0.3 million.
- Excluding special items, non-GAAP net loss was $14.8 million, or $0.59 per share, compared to first quarter fiscal 2017 non-GAAP net loss of $16.4 million, or $0.66 per share, and compared to second quarter fiscal 2016 non-GAAP net loss of $18.4 million, or $0.76 per share.
- Cash and cash equivalents, restricted cash and short-term investments totaled $36.4 million as of July 31, 2016.
Comments
Violin sounds wrong.
It's impossible for the vendor to pursue its business with such catastrophic financial results: $7.5 million in sales is the lowest figure since 2013 when the company went public; if net loss are decreasing, the amount remains enormous, $20.6 million; $36 million in cash after a $13 million cash burn in for the quarter.
The company expected much more revenue, in the range of $11 million to $13 million, for the this last three-month period.
During this period, product revenue was a mere $2.1 million, compared to $5.4 million for services.
President and CEO Kevin DeNuccio admits the bad situation: "This quarter's performance is obviously frustrating and disappointing as we strongly believe it could be the quarter that returns revenue upward after a downward trend for more than a year. Both of our international theaters in the EMEA and APAC had extremely difficult product sales in the quarter. The international markets alone could account for a short fall from expectations."
Since 1Q13 the flash array maker has cumulated total revenue of $3 billion with cumulated losses of $4.7 billion.
Its existing cash balance is insufficient to operate the business in the next future and the vendor is seeking additional cap further to fund operations and to survive.
When a company is falling like that, in the most growing storage market, all-flash arrays, the responsibility come from the products and/or the management.
Violin attacks he high-end market where the competition is ferocious. It was unable to close significant orders in time from Fortune 100 customers. Two of its top five customers have been testing or evaluating its new family of products but were not available for revenue last quarter.
The company had only two new customers in three months, down from seven in the prior quarter, and these new ones accounted for only 2% of total revenue down from 10% last quarter.
Kevin DeNuccio was named president and CEO in February 2014 replacing interim CEO Howard Bainand, and has not been able to change the situation at all, now worst than ever. Return to revenue growth took much longer than anticipated and has not started.
On total sales, 77% came from the Americas, up from 70% last quarter. EMEA was 17%, about the same as last quarter, and Asia was down to 6% from 15% the former quarter.
Transactions direct with end users were 34% of total revenue as compared with 28% last quarter.
Total headcount at the end 2FQ16 was 235, as compared to 258 at the end of 1FQ16 and to 318 at the end of last fiscal year. Sales and marketing headcount at the end of the quarter was 78 versus 89 the former one, and engineering was 99 versus 108 respectively. But including the 20 plus developers, Violin has on staff with new R&D partner GlobalLogic in Ukraine, and engineering workforce is greater than the prior quarter. Remember that, as of July 31, 2013, Violin had 445 employees, including 186 in R&D.
Last chance for the firm will be probably the arrival of a next gen family of Flash Storage Platform, the announcement being scheduled in few days, on September 14, 2016.
Other bad news for analysts: Violin have decided not to provide quarterly guidance for at least the next two quarters.
Violin Memory's main financial results since 3FQ13
(in $ million)
| Fiscal quarter | Revenue | Loss |
| 3Q13 | 20.6 | (34.1) |
| 4Q13 | 22.9 | (35.4) |
| 1Q14 | 24.8 | (28.5) |
| 2Q14 | 26.5 | (30.6) |
| 3Q14 | 28.3 | (34.1) |
| 4Q14 | 28.0 | (56.5) |
| 1Q15 | 18.1 | (30.1) |
| 2Q15 | 18.6 | (8.4) |
| 3Q15 | 21.7 | (23.5) |
| 4Q15 | 20.5 | (46.8) |
| 1Q16 | 12.1 | (26.5) |
| 2Q16 | 15.3 | (24.4) |
| 3Q16 | 12.5 | (22.7) |
| 4Q16 | 10.9 | (25.5) |
| 1Q16 | 9.7 | (22.2) |
| 2Q16 | 7.5 | (20.6) |
| Cumulative from 3Q13 to 2Q16 | 2,980 | (4,699) |
Violin Memory stock chart
(in $)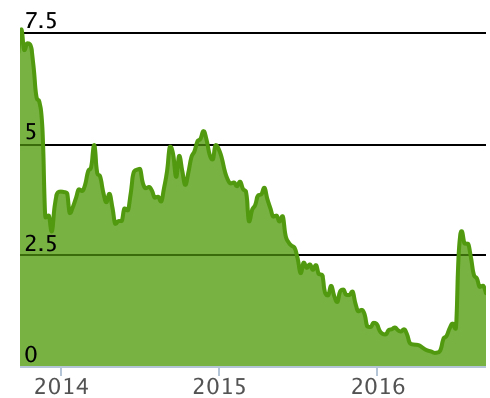


 Subscribe to our free daily newsletter


