


More Reliable HDDs Based on 56,224 Tested Units – Backblaze
In order from HGST, Toshiba, Seagate and Western Digital
This is a Press Release edited by StorageNewsletter.com on February 24, 2016 at 2:27 pm On the blog of Backblaze, Inc., Andy Klein wrote the following report.
HDD Reliability Review for 2015
By the end of 2015, the Backblaze datacenter had 56,224 spinning HDDs containing customer data. These HDDs reside in 1,249 Backblaze Storage Pods. By comparison 2015 began with 39,690 drives running in 882 Storage Pods. We added 65PB of storage in 2015 give or take a petabyte or two. Not only was 2015 a year of growth, it was also a year of drive upgrades and replacements. Let’s start with the current state of the HDDs in our datacenter as of the end of 2015 and then dig into the rest later on.
HDD Statistics for 2015
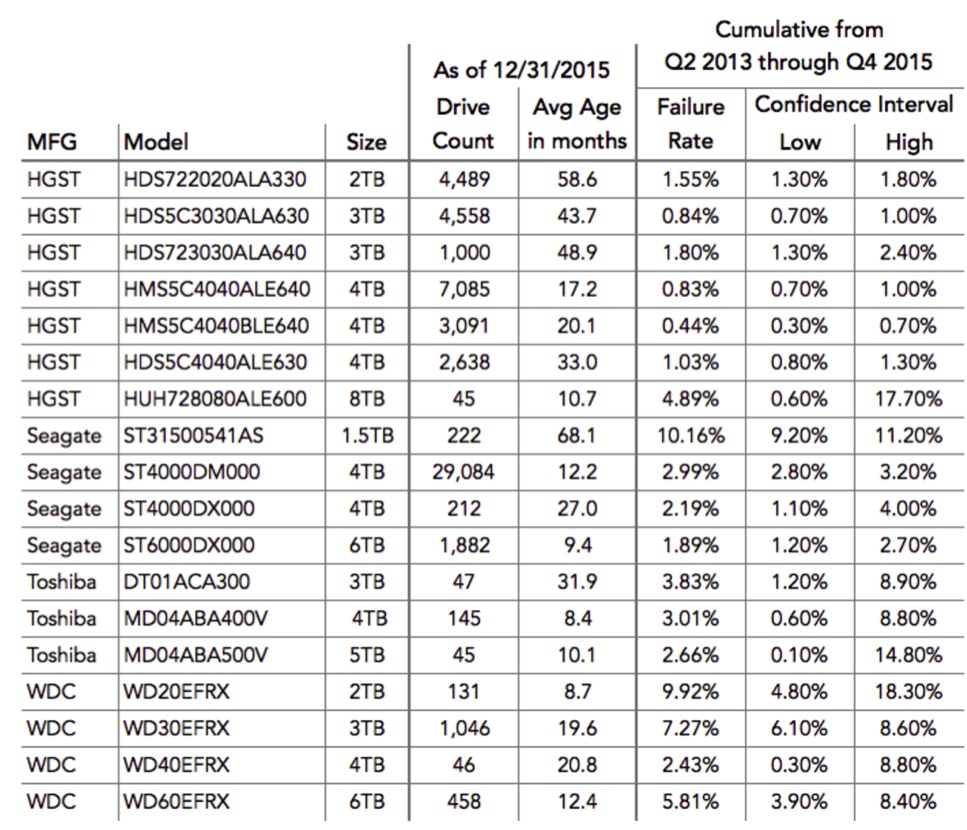
The table below contains the statistics for the 18 different models of HDDs in our datacenter as of 31 December 2015. These are the HDDs used in our Storage Pods to store customer data. The Failure Rates and Confidence Intervals are cumulative from Q2 2013 through Q4 2015. The Drive Count is the number of drives reporting as operational on 31 December 2015.
During 2015, five drive models were retired and removed from service. These are listed below. The Cumulative Failure Rate is based on data from Q2 2013 through the date when the last drive was removed from service.
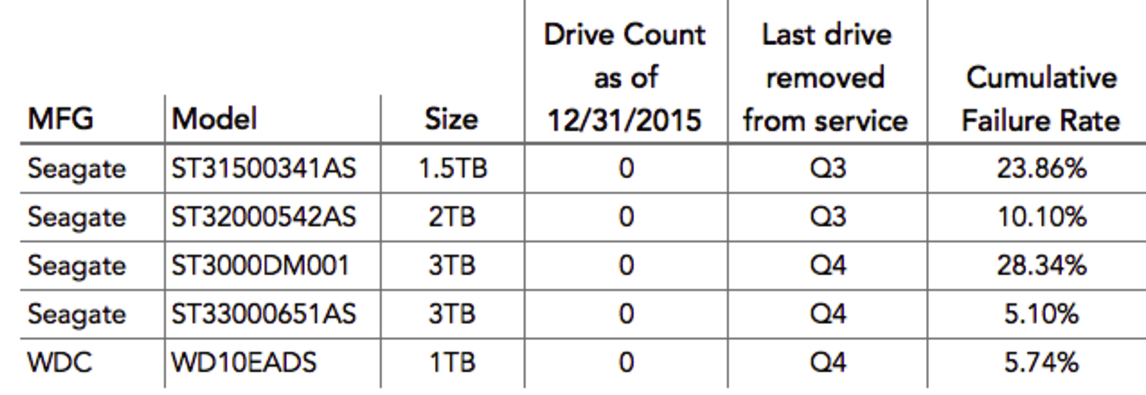
Note that drives retired and removed from service are not marked as ‘failed’, they just stop accumulating drive-hours when they are removed.
Computing Drive Failure Rates
This is a good point to review how we compute our drive failure rates. There are two different ways to do this, either works.
For the first way, there are four things required:
- A defined group to observe, in our case a group of drives, usually by model,
- a period of observation, typically a year,
- the number of drive failures in the defined group over the period of observation, and
- the number of hours a group of drives are in operation over the period of observation.
Let’s use the example of 100 drives which over the course of 2015 accumulated a total of 750,000 power-on-hours based on their SMART 9 RAW values. During 2015, our period of observation, five drives failed.
We use the following formula to compute the failure rate:
(100*drive-failures)/(drive-hours/24/365)
(100*5)/(750,000/24/365)
This gives us a 5.84% annual failure rate for 2015.
For the second method, the only change is how we count the time a group of drives is in service. For a given drive we simply count the number of days that drive shows up in our daily log files. Each day a drive is listed it counts as one drive-day for that HDD. When a drive fails it is removed from the list and its final count is used to compute the total number of drive-days for all the drives being observed.
The drives in the datacenter come from four manufacturers. The following chart shows the cumulative HDD failure rates by manufacturer for all drives:
Failure rates by manufacturer
Cuulated from 4/2013 to 12/2015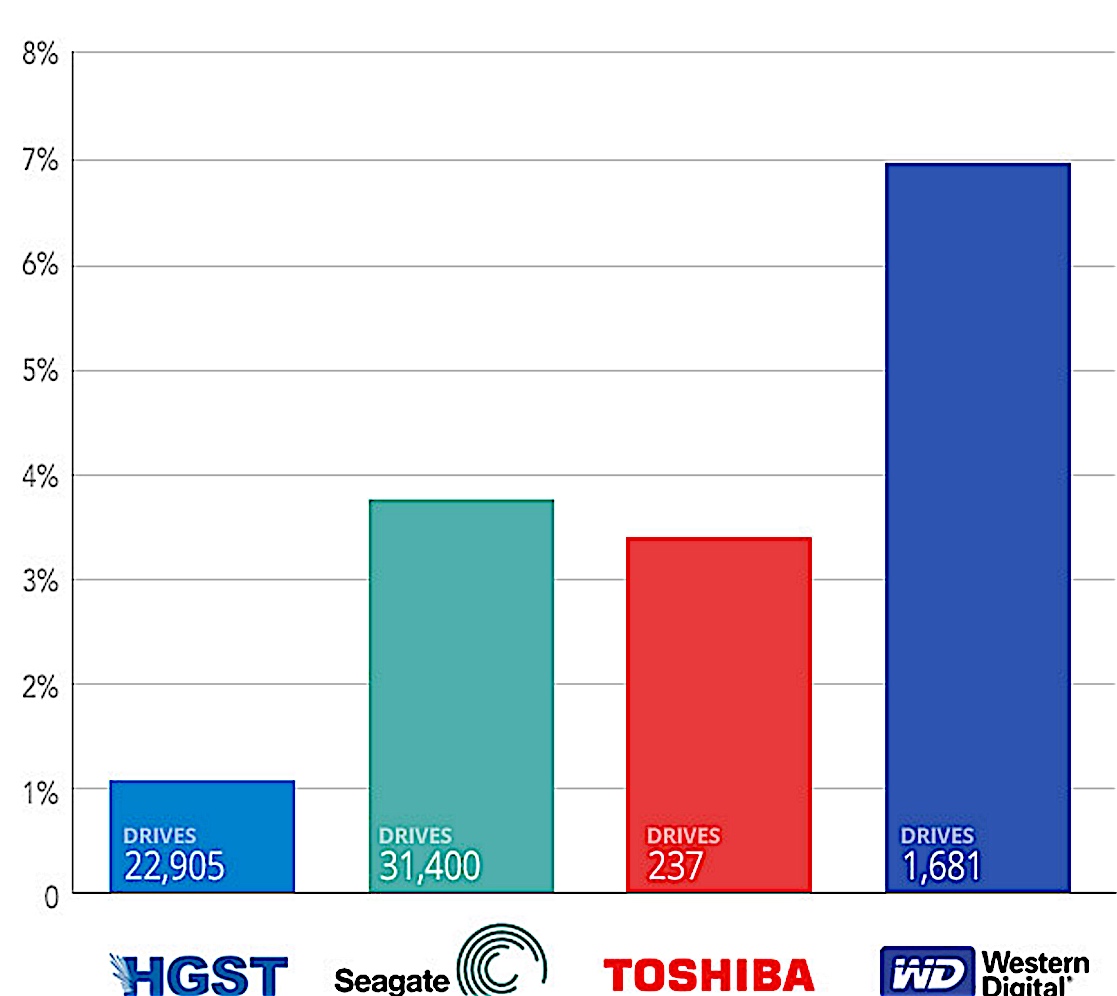
HDD Failures by Manufacturer
Let’s take a look at the ‘make up’ of the drives in our datacenter.
Backblaze datacenter drive count by manufacturer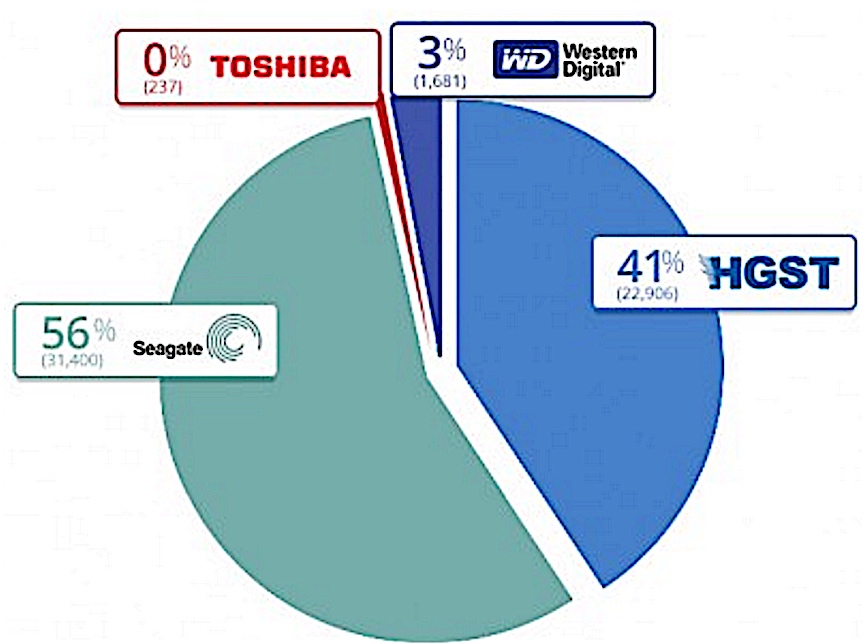
Backblaze datacenter drive days in service by manufacturer
The first chart above is the total number of drives and the second chart is the total number of drive hours for all the data drives by each manufacturer. Notice there are more Seagate drives but the HGST drives have more hours. The HGST drives are older, as such they have more drives hours, but most of our recent drive purchases have been Seagate drives. Case in point, nearly all of the 16,000+ drives purchased in 2015 have been Seagate drives. Of the Seagate drives purchased in 2015, over 85% were 4TB HDDs.
HDD Reliability by Drive Size
1TB HDDs
We removed the last of our 1TB drives during Q4 and ended the quarter with zero installed. This was done to increase the amount of storage in a 1TB filled Storage Pod as we replaced the 1TB drives with 4TB drives (and sometimes 6TB drives). Now in the same Storage Pod we get four times as much data. The 1TB Western Digital drives performed well with many of the drives exceeding 6 years in service and a handful reaching 7 years before we replaced them. The cumulative annual failure rate was 5.74% in our environment, a solid performance.
We actually didn’t retire these 1TB WD drives – they just changed jobs. We now use many of them to ‘burn-in’ Storage Pods once they are done being assembled. The 1TB size means the process runs quickly, but is still thorough. The burn-in process pounds the drives with reads and writes to exercise all the components of the system. In many ways this is much more taxing on the drives then life in an operational Storage Pod. Once the ‘burn-in’ process is complete, the WD 1TB drives are removed and we put 4TB or 6TB drives in the pods for the cushy job of storing customer data. On the other hand, the workhorse 1TB WD drives are returned to the shelf where they dutifully await the next ‘burn-in’ session.
2TB HDDs
The Seagate 2TB drives were also removed from service in 2015. While their cumulative failure rate was slightly high at 10.1%, they were removed from service because we only had 225 of those drives and it was easier to upgrade the pods to 4TB drives than to buy and stock the 2TB Seagate drives.
On the other hand, we still have over 4,500 HGST 2TB drives in operation. Their average age is nearly 5 years (58.6 months) and their cumulative failure rate is a meager 1.55%. At some point we will want to upgrade the 100 Storage Pods they occupy to 4TB or 6TB drives, but for now the 2TB HSGT drives are performing very well.
3TB HDDs
The last of the 3TB Seagate drives were removed from service in the datacenter during 2015. Below is a chart of all of our 3TB drives that were in our datacenter anytime from April 2013 through the end of Q4 2015.
Cumulative failure rate through the period ending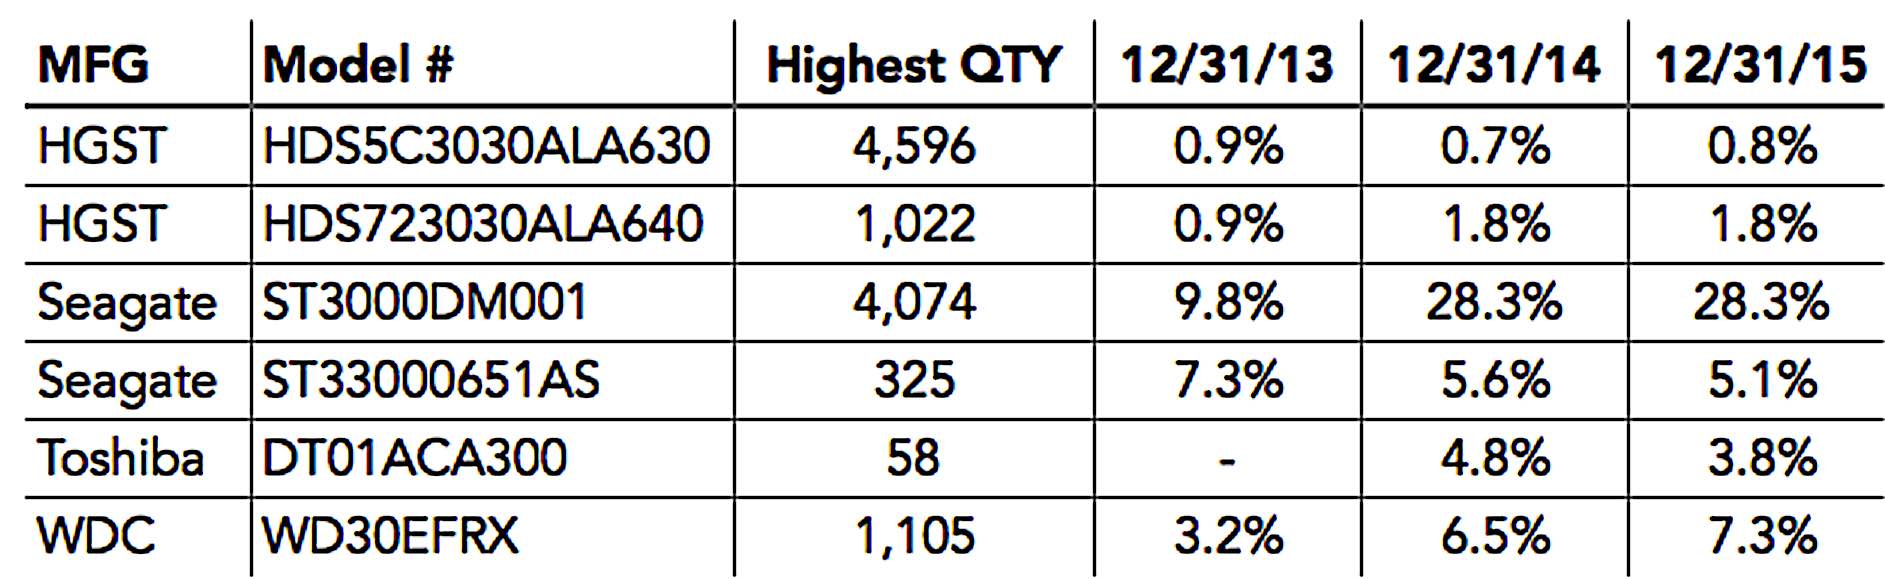
4TB HDDs
As of the end of 2015, 75% of the HDDs in use in our datacenter were 4TB in size. That represents 42,301 drives broken down as follows by manufacturer:
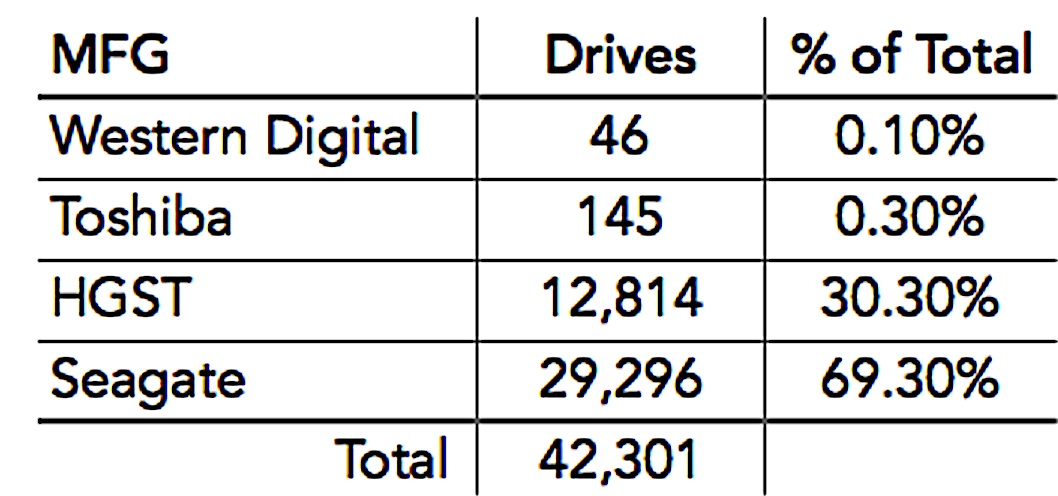
The cumulative failure rates of the 4TB drives to date are shown below:
Failure rate for 4TB drive by manufacturer
Cumulative from 4/2013 to 12/2015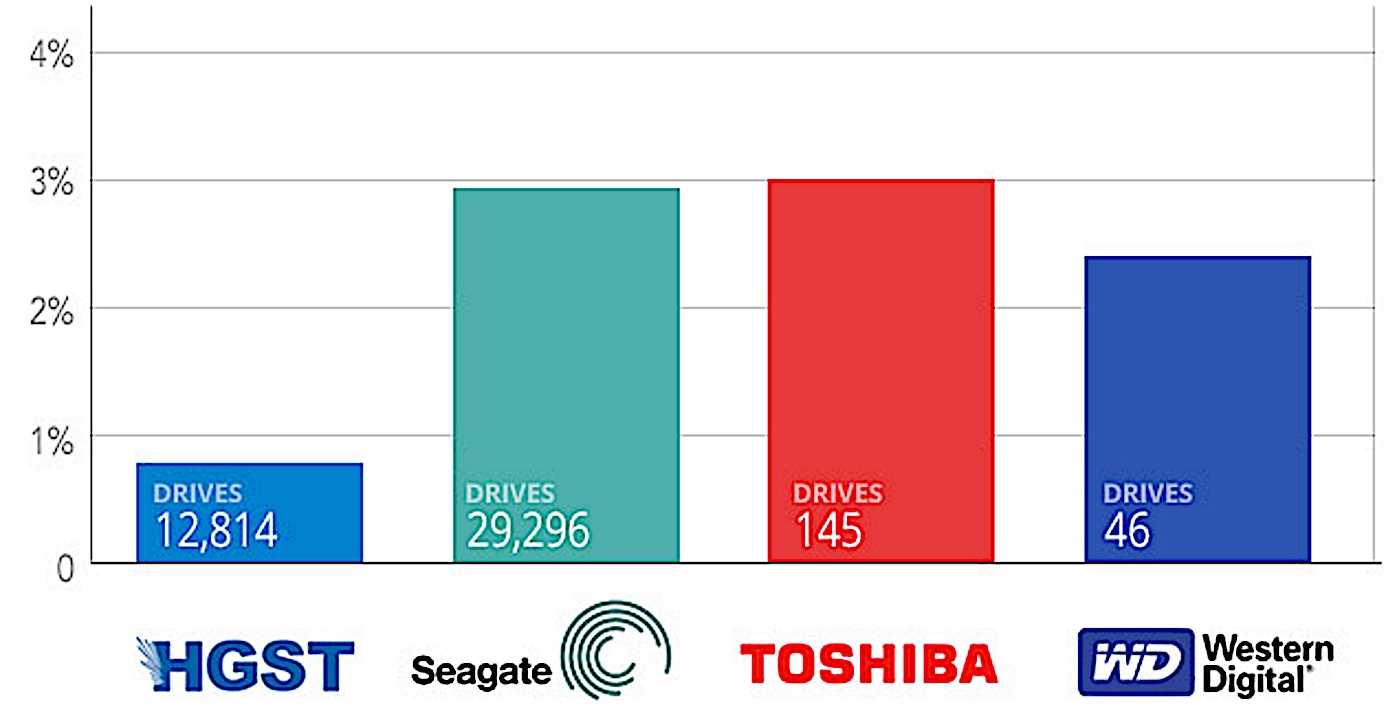
All of the 4TB drives have acceptable failure rates, but we’ve purchased primarily Seagate drives. Why? The HGST 4TB drives, while showing exceptionally low failure rates, are no longer available having been replaced with higher priced, higher performing models. The readily available and highly competitive price of the Seagate 4TB drives, along with their solid performance and respectable failure rates, have made them our drive of choice.
A relevant observation from our operations team on the Seagate drives is that they generally signal their impending failure via their SMART stats. Since we monitor several SMART stats, we are often warned of trouble before a pending failure and can take appropriate action. Drive failures from the other manufacturers appear to be less predictable via SMART stats.
6TB HDDs
We continued to add 6TB drives over the course of 2015, bringing the total to nearly 2,400 drives (1,882 Seagate, 485 Western Digital.) Below are the Q4 and Cumulative Failure Rates for each of these drives.
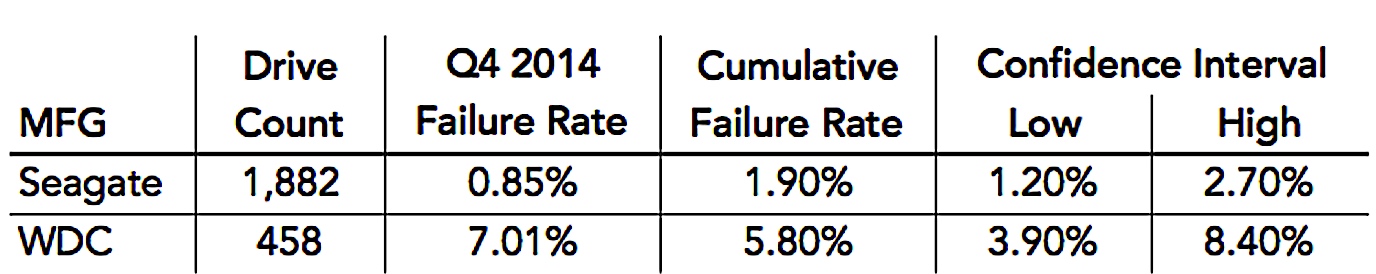
The Seagate 6TB drives are performing very well, even better than the 4TB Seagate drives. So why do we continue to buy 4TB drives when quality 6TB drives are available?
Three reasons:
- Based on current street prices, the cost per TB of the 4TB drives (0.028/GB) is less that of the 6TB drives (0.044/GB).
- The channels we purchase from are not flush with 6TB drives, often limiting sales to 50 or 100 units. There was a time during our drive farming days when we would order 50 drives and be happy, but in 2015 we purchased over 16,000 new drives. The time and effort of purchasing small lots of drives doesn’t make sense when we can purchase 5,000 4TB Seagate drives in one transaction.
- The 6TB drives like electricity. The Average Operating Power is 9.0W for a Seagate 6TB drive. That is 60% more than the 5.6W used by the 4TB Seagate drives we use. When you have a fixed amount of power per rack, this can be a problem. The easy answer would seem to be to add more electric to the rack, but as anyone who designs datacenters knows it’s not that simple. Today, we mix 6TB filled Storage Pods and 4TB filled Storage Pods in the same rack to optimize both power consumption and the storage space per square foot.
5TB and 8TB HDDs
We continue to only have 45 of each of the 5TB Toshiba and 8TB HGST helium drives. One 8TB HGST drive failed during Q4 of 2015. Over their lifetime the 5TB Toshiba drives have a 2.70% annual failure rate with one drive failure and the 8TB HGST drives have a 4.90% annual failure rate with two drive failures. In either case, there is not enough data to reach any conclusions about failure rates of these drives in our environment.
Drive Stats Data
Each day we record and store the drive statistics on every drive in our datacenter. This includes the operational status of the drive, along with the SMART statistics reported by each drive. We use the data collected to produce our Drive Stats reviews. We also take this raw data and make it freely available by publishing it on our website. We’ll be uploading the Q4 2015 data in the next few days then you will be able to download the data so you can reproduce our results or you can dig in and see what other observations you can find.


 Subscribe to our free daily newsletter

