


HDD Reliability Stats for 1Q15 – Backblaze
Comparison of HGST, Seagate and WD units
This is a Press Release edited by StorageNewsletter.com on May 29, 2015 at 1:50 pmThis article has been written on the blog of Backblaze, Inc. by Andy Klein.
Hard Drive Reliability Stats for Q1 2015, May 21, 2015
Over the past year we’ve been releasing HDD reliability statistics based on the drives we use to store customer data for our online backup business.
As of the end of Q1 2015 we had 44,252 HDDs spinning in our datacenter. If we subtract boot drives and drive models with less than 45 drives from that total, we get 42,749 HDDs remaining spread across 21 drive models.
Below are the HDD reliability statistics for these drives for Q1 2015.
Backblaze HDD Failure Rates January 1 – March 31, 2015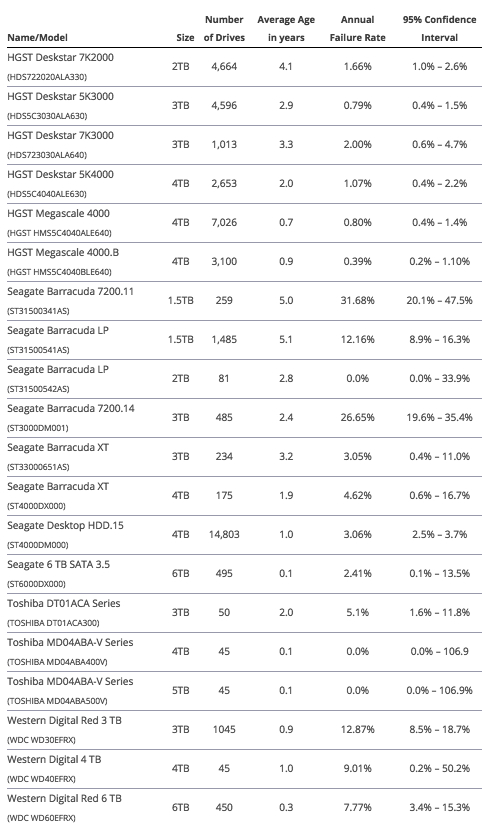
Note: Some of the HGST drives listed were manufactured under their previous brand, Hitachi. We’ve been asked to use the HGST name and we have honored that request.
HDDs In and HDDs Out
In our most recent HDD study for Q4 2014 we analyzed 39,696 drives. There are 3,053 more drives in our Q1 2015 results. We actually deployed over 4,000 drives, as we replaced 324 failed drives as well as 631 Seagate 3TB suspect drives. During Q1 we deployed two Backblaze Vaults containing 900 drives each and 44 standalone Storage Pods with 45 drives each.
Observations and Trends
Looking at the Q1 HDD reliability stats above you can compare failure rates for the various drive models. The important thing to remember is that the table is a snapshot in time: Q1 of 2015. Below are the cumulative failure rates for the same 21 drive models beginning with Q4 of 2013 and progressing quarterly up through Q1 2015.
Backblaze HDD Failure Rates, Cumulative by Quarter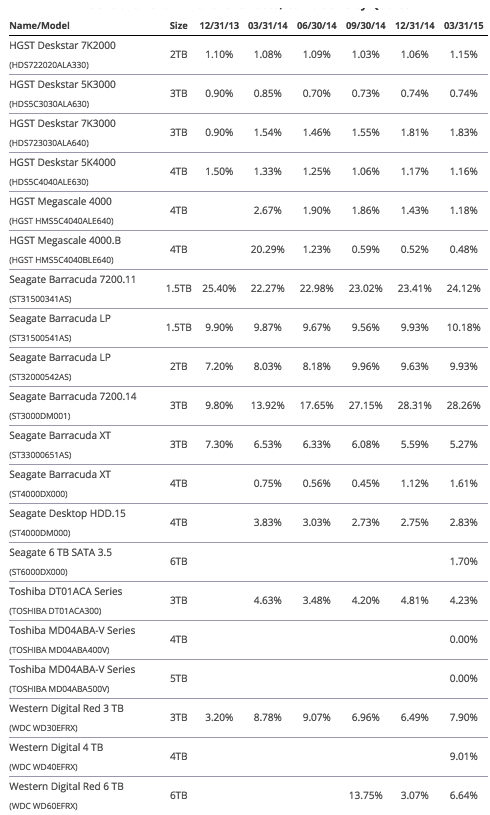
The cumulative view can be used to see trends over time as well as spot anomalous periods requiring further review. Remember that in the first quarter a given drive is deployed the results can be skewed due to the limited number of drives and deployment hours.
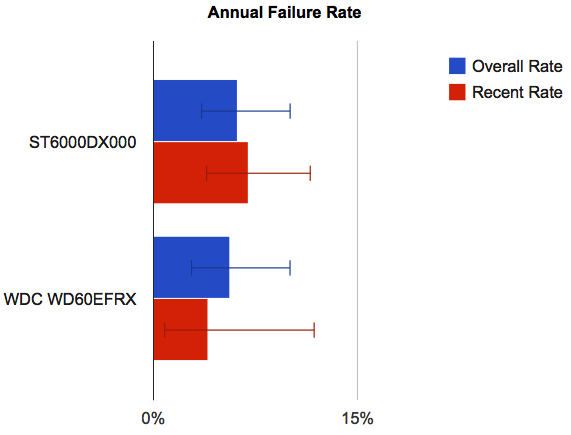
Combining Views
Internally we combine the cumulative and the current failure rates for each drive into a graph so we can quickly see if there are any changes requiring our attention. Below is a sample showing this information for the two 6TB drive models we currently deploy. The ‘overall rate’ is the cumulative failure rate since the drive model was put into service and the ‘recent rate’ is the failure rate over the past 2 months.
The data for Q1 2015 is available from our HDD Data web page where it can be downloaded for further study. The format for the 2015 data file changed with the addition SMART 22 attribute (Raw and Normalized) and 4 additional SMART stat pairs.


 Subscribe to our free daily newsletter

