


Seagate: Fiscal 2Q15 Financial Results
Modest quarter, next one to be worst
This is a Press Release edited by StorageNewsletter.com on January 27, 2015 at 3:00 pm| (in $ million) | 2Q14 | 2Q15 | 6 mo. 14 | 6 mo. 15 |
| Revenue | 3,528 | 3,696 | 7,017 | 7,481 |
| Growth | 5% | 7% | ||
| Net income (loss) | 428 | 933 | 855 | 1,314 |
Seagate Technology plc reported financial results for the second quarter of fiscal year 2015 ended January 2, 2015.
For the second quarter, the company reported revenue of approximately $3.7 billion, gross margin of 27.8%, net income of $933 million and diluted earnings per share of $2.78. On a non-GAAP basis, which excludes the net impact of certain items, including a $620 million net gain on the arbitration award, Seagate reported gross margin of 28.2%, net income of $452 million and diluted earnings per share of $1.35.
During the second quarter, the company generated approximately $1.4 billion in operating cash flow, paid cash dividends of $177 million and repurchased approximately 0.3 million ordinary shares for $18 million. There were 329 million ordinary shares issued and outstanding as of the end of the quarter. Cash, cash equivalents, restricted cash, and short-term investments totaled approximately $3.3 billion at the end of the quarter.
“Seagate’s second fiscal quarter performance is the result of consistent execution and our solid competitive positioning in the storage technology marketplace,” said Steve Luczo, Seagate’s chairman and CEO. “In addition, our cash flow generation remains strong as we continue to effectively balance investing in our business with returning capital to shareholders.“
Quarterly Cash Dividend
The board of directors has approved a quarterly cash dividend of $0.54 per share, which will be payable on February 24, 2015 to shareholders of record as of the close of business on February 10, 2015. The payment of any future quarterly dividends will be at the discretion of the board and will be dependent upon Seagate’s financial position, results of operations, available cash, cash flow, capital requirements and other factors deemed relevant by the Board.
Comments
Depending on the quarterly periods compared, Seagate achieves relatively good or bad results:
- - From 2FQ14 to 2FQ15, revenue increased 5%, net more than doubled and HDD shipped were up a mere 0.5%
- - From 1FQ15 to 2FQ15 revenue decreased 3%, net increased 145% (mainly explained by legal settlement payout from WD) and HDD shipped were down 4% at 56.9 million.
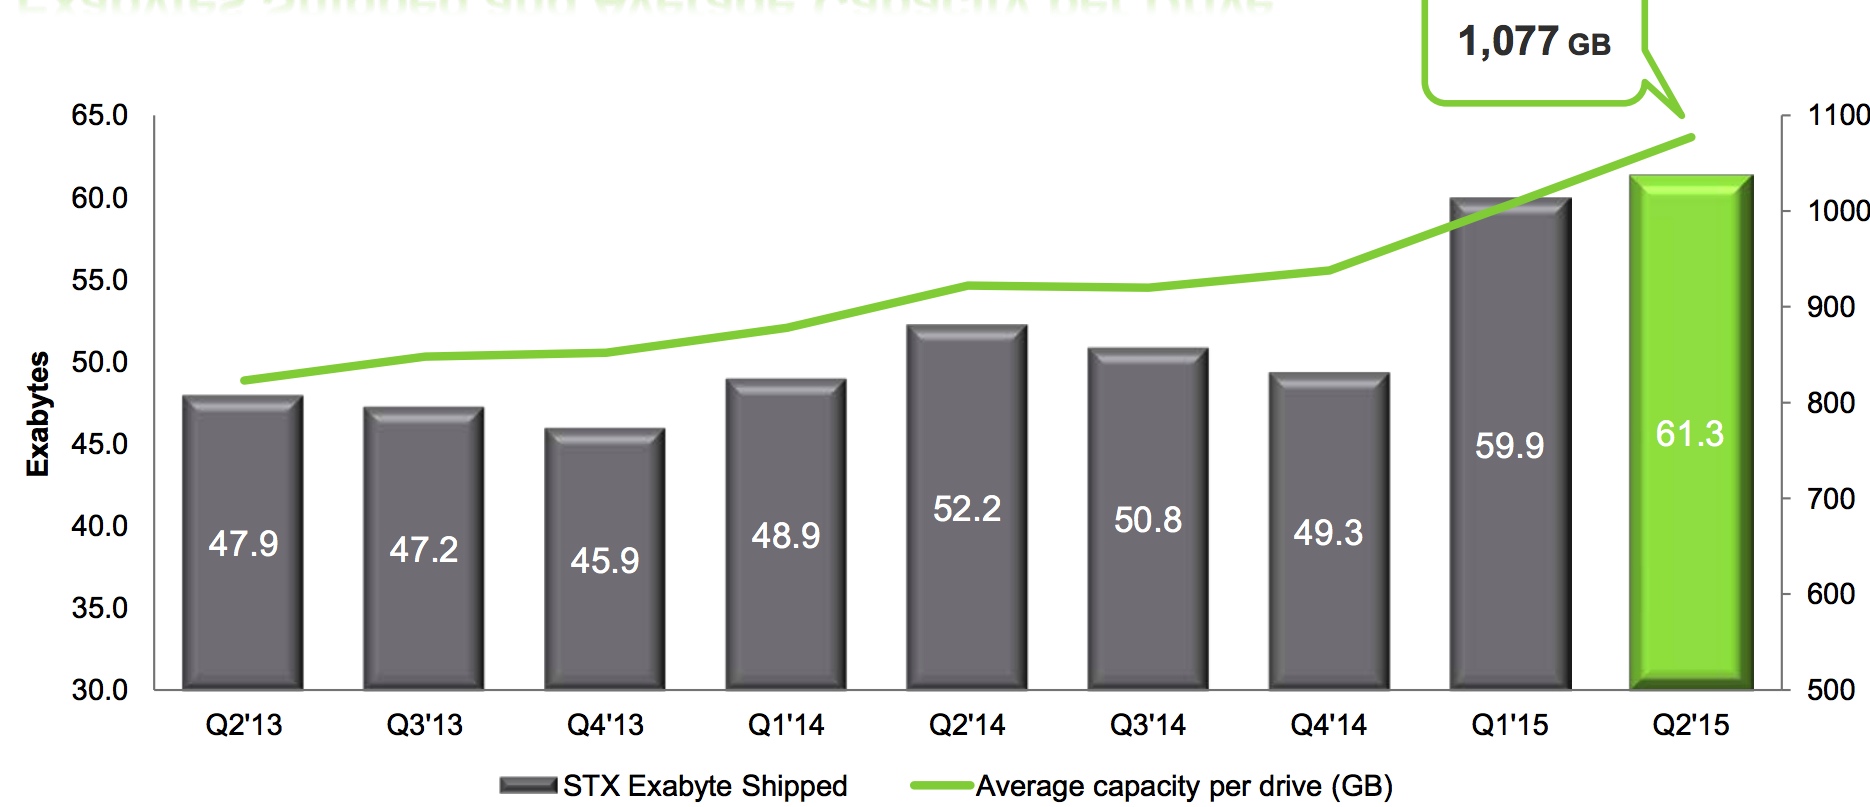
Average capacity per drive sold surpassed 1TB for the second quarter at 1,077MB with especially a good position in 6TB HDDs, and total capacity shipped is up 17% Y/Y at record of 61.3EB.
The company continues to be strong in enterprise HDDs but is losing market share for desktop units.
EBs shipped by Seagate and average capacity per drive
The company estimates to own a 40% share in the worldwide HDD market in 2FQ15 - behind WD and in front of Toshiba - for a TAM between 144 to 145 million units.
In term of guidance, chairman and CEO Steve Luczo commented:
"While we are generally optimistic about calendar year 2015 in terms of the demand for storage and overall economic activity, especially that of the United States, we are tempered somewhat by the instability of the European business environment as well as the commodity and currency volatility throughout the world.
"For example, Europe represents approximately 20% of our revenues and in retail we would have historically experienced an increase of about 5% revenue in the December quarter and in fact it declined by about 5%.
"Industry estimates for the HDD market demand are forecasting a seasonal decrease and we believe TAM will be approximately 135 million units in the March quarter.
" (...) we expect to achieve revenue of at least $3.45 billion in the March quarter."
Or down 6% sequentially.
To read the earnings call transcript
Seeagate's HDDs from 2FQ13 to 2FQ15 (units in million)
| Period | Enterprise | Desktop | Notebook | CE | Branded | Total | ASP | Exabyte | Average |
| HDDs | Shipped* | GB/Drive | |||||||
| 2Q13 | 7.3 | 21.9 | 17.3 | 5.6 | 6.0 | 58.2 | $62 | 47.9 | 823 |
| 3Q13 | 7.5 | 19.6 | 17.0 | 5.8 | 5.7 | 55.7 | $63 | 47.2 | 848 |
| 4Q13 | 8.2 | 18.6 | 16.1 | 6.1 | 4.8 | 53.9 | $63 | 45.9 | 852 |
| 1Q14 | 8.1 | 19.1 | 17.2 | 6.2 | 5.1 | 55.7 | $62 | 48.9 | 878 |
| 2Q14 | 7.8 | 19.2 | 16.9 | 6.7 | 6.2 | 56.6 | $62 | 52.2 | 922 |
| 3Q14 | 7.7 | 19.8 | 16.4 | 5.4 | 5.9 | 56.2 | $61 | 50.8 | 920 |
| 4Q14 | 7.4 | 18.4 | 16.8 | 5.1 | 4.8 | 52.5 | $60 | 49.6 | 945 |
| 1Q15 | 8.8 | 18.7 | 20.2 | 6.0 | 5.7 | 59.5 | $60 | 59.9 | 1,007 |
| 2Q15 | 9.1 | 16.0 | 19.7 | 6.1 | 6.0 | 56.9 | $61 | 61.3 | 1,077 |


 Subscribe to our free daily newsletter

