


HDD, SSHD, SSD Performance Comparison
Authored by Calypso and based on SNIA test sepcs
This is a Press Release edited by StorageNewsletter.com on December 30, 2013 at 2:58 pmThis information has been posted by Calipso Systems, Inc.‘s CEO Eden Kimon August 15, 2013 and and published by SNIA SSSI.
Summary Performance Comparison – HDD, SSHD, SSD
The measurements were taken by Calypso on the SSSI RTP/CTS test platform pursuant to SNIA Solid State Storage Performance Test Specification version 1.1.
How does one use the PTS to evaluate and compare SSD performance? First, data should be collected by using the SNIA PTS on an SSSI Reference Test Platform (RTP) to get standardized and normalized results. The user should then select the key measurements from each of the three metrics (IO/s, TP and LAT) to compare the overall performance.
There are commonly accepted block size and RW mixes that are used to evaluate SSD performance. While users may have an interest in other specific access patterns, industry convention uses device level ‘corner case’ (or boundary) testing to evaluate SSD performance.
While IO/s, TP and LAT have long been used for the testing of HDDs, the SNIA PTS methodology has added solid state storage specific processes to accommodate the uniqueness of SSD performance. Specifically, the PTS defines a standardized pre-conditioning and steady state determination to ensure the SSD is properly prepared as well as SSD specific tests that address SSD specific performance behaviors.
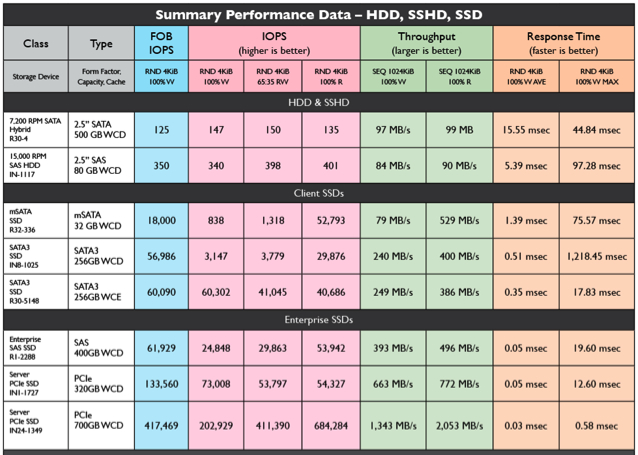
The chart above shows summary performance data for HDD, solid state hybrid drive (SSHD), mSATA, SATA, SAS and PCIe SSDs. In this chart, there are four measurements for IO/s, two for TP and two for response times. This provides an overview of overall performance. Different access patterns can be selected for summary view.
To go to the SNIA SSSI SSD Performance – A Primer White Paper


 Subscribe to our free daily newsletter


