Brocade: Fiscal 2Q10 Financial Results
SAN revenues down 23% sequentially
This is a Press Release edited by StorageNewsletter.com on May 21, 2010 at 3:14 pm| (in US$ millions) | 2Q09 | 2Q10 | 6 mo. 09 |
6 mo. 10 |
| Revenues | 506.3 | 501.0 | 937.9 | 1,040.5 |
| Growth | -1% | +11% | ||
| Net income (loss) | (66.1) | 22.4 | (90.0) | 73.5 |
Brocade Communications Systems, Inc. reported financial results for its second fiscal quarter ended May 1, 2010. Brocade recorded quarterly revenues of $501 million or a decrease of one percent year-over-year, resulting in a diluted earnings per share (EPS) of $0.05 on a GAAP basis and $0.13 on a non-GAAP basis.
“Q2 was highlighted by a strong recovery in our Ethernet business, particularly in the Federal sector, which grew over 160% sequentially. The quarter highlights also included robust end-user demand for our storage networking products, measured on a sell-through basis, driven by positive macro trends such as the growth of the Fibre Channel market,” said Michael Klayko, CEO of Brocade.
Klayko continued: “Looking forward, we will continue to aggressively pursue the initiatives we have put into place to continue to drive sales of our Ethernet solutions to help meet our long-term goals for that part of our business. We are also encouraged by the apparent stabilization and recovery of IT spending trends globally that should help drive further momentum for our overall business in the second, and typically stronger, half of our fiscal year.”
Financial Highlights:
- Q2 revenue was $501.0 million, decreasing 7.1% sequentially and 1.1% year-over-year.
- Q2 GAAP EPS (diluted) was $0.05, decreasing 54.5% sequentially and increasing from a loss in Q2 2009.
- Q2 non-GAAP EPS (diluted) was $0.13, decreasing 31.6% sequentially and increasing 18.2% year-over-year.
- Q2 non-GAAP operating margin was 20.5% versus 26.0% in Q1 2010 and 18.8% in Q2 2009.
- Q2 effective GAAP tax rate was (3.9)%; non-GAAP effective tax-rate was 24.4%.
- Q2 Adj. EBITDA was $116.4 million, down from $154.7 million in Q1 2010 and $119.9 million in Q2 2009.
-
Q2 total Storage Area Networking (SAN) port shipments were approximately 1.0 million.
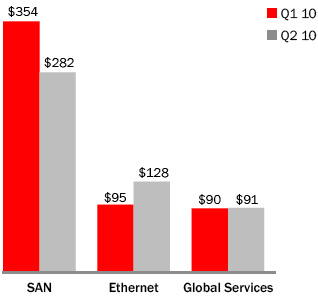
Segment Revenues Q1 Vs. Q2
(in U.S. $ millions)

Segment Revenues 2Q10 Vs. 1Q10 and 2Q09
(in percentage)
![]()
Comments
Commenting its quarterly results, Brocade said:
"Turning to revenues by business unit, SAN represented 56% of revenues in Q2 versus 65% in Q1. End-user demand for Brocade’s leading SAN products remains very strong and was the highest for any Q2 in the history of the company. As a reminder, Brocade recognizes revenue based on sell-in to our OEMs principally on SAN and our direct sales and on a sell through basis for OEMs, sales, sell-our distributors and value added resellers on both Ethernet and SAN.
"The migration to 8 Gig Fibre Channel continues to be an important technology trend for our customers and for the Fibre Channel market at large. As a technology leader, Brocade was first-to-market with both 4 and 8 Gig products and is leading the transition today. Our revenue that we identify as 8 Gig grew to 78% in Q2 versus 66% in Q1 of both our directors and switches product lines. Our SAN ASP sequential declines were in the low single digits.
"Our server product group, consisting of embedded switches, CNAs, HBAs, and mezzanine cards, posted revenues of $40.4M, which were up 32% year-over-year and down 12% off our record Q1.
"Embedded switches were down sequentially while CNAs, HBAs and mezzanine cards collectively were up almost 50% sequentially. Overall, Q2 was the second highest server revenue quarter for Brocade in our history."
To read the earnings call transcript


 Subscribe to our free daily newsletter

